Towards a Comprehensive Cohort Visualization of Patients with Inflammatory Bowel Disease
Salmah Ahmad, David Sessler, Jörn Kohlhammer
External link (DOI)
View presentation:2021-10-24T15:00:00ZGMT-0600Change your timezone on the schedule page
2021-10-24T15:00:00Z
Abstract
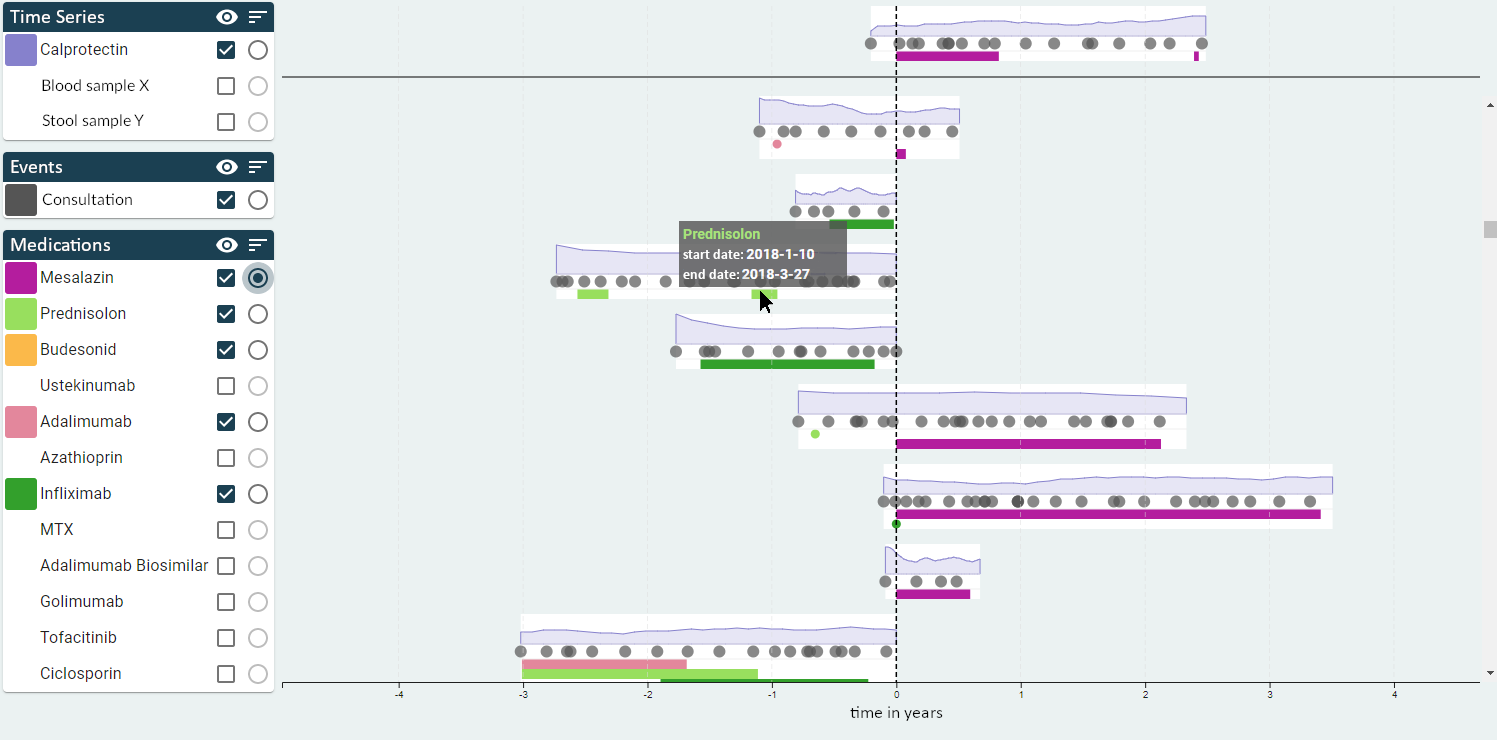
This paper reports on a joint project with medical experts on inflammatory bowel disease (IBD). Patients suffering from IBD, e.g. Crohn’s disease or ulcerative colitis, do not have a reduced life expectancy and disease progressions easily span several decades. We designed a visualization to highlight information that is vital for comparing patients and progressions, especially with respect to the treatments administered over the years. Medical experts can interactively determine the amount of information displayed and can synchronize the progressions to the beginning of certain treatments and medications. While the visualization was designed in close collaboration with IBD experts, we additionally evaluated our approach with 35 participants to ensure good usability and accessibility. The paper also highlights the future work on similarity definition and additional visual features in this on-going project.