User-Centered Design of Visualizations for Software Vulnerability Reports
Steven Lamarr Reynolds, Tobias Mertz, Steven Arzt, Jörn Kohlhammer
External link (DOI)
View presentation:2021-10-27T17:40:00ZGMT-0600Change your timezone on the schedule page
2021-10-27T17:40:00Z
Fast forward
Direct link to video on YouTube: https://youtu.be/Mu4wcRL0HP8
Keywords
Fraunhofer IGD, Darmstadt
Abstract
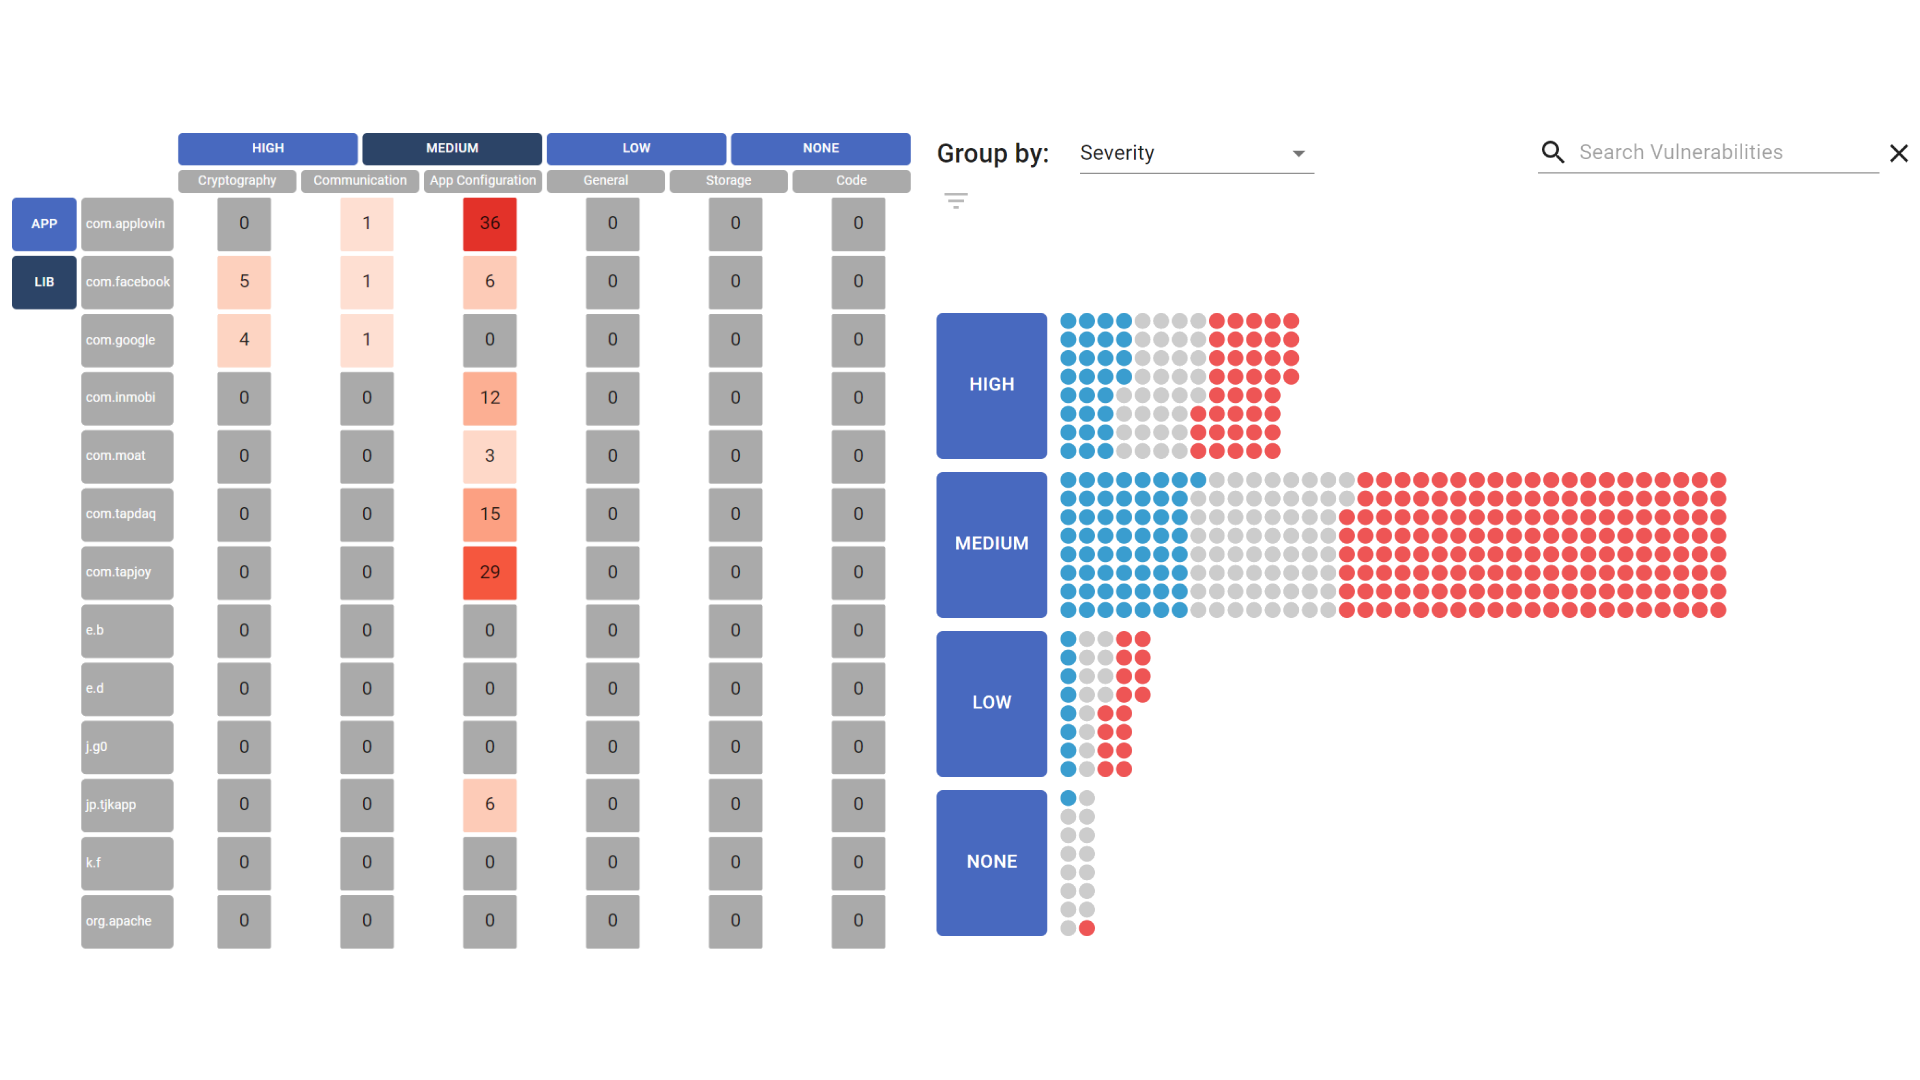
Today's software systems are created by software development processes that naturally include mistakes, some of which can be exploited by attackers and are therefore called vulnerabilities. Automatic software scanners enable developers to analyze their applications to detect vulnerabilities and alert them of their presence. But often these reports are hard to understand, include false positives or overwhelm users due to the sheer number of alerts, since a report may contain hundreds to thousands of vulnerabilities. Developers must undergo a process called vulnerability triage to find the relevant vulnerabilities to fix. This paper presents two interactive visualizations for developers and security experts to gain an overview of the security state of their application. Users can see the distribution of vulnerabilities, find the most relevant ones, and compare differences between application versions. Our visualization design is inspired by an initial preliminary study and has been evaluated by domain experts to investigate the usability and appropriateness.