Towards Visual Analytics Dashboards for Provenance-driven Static Application Security Testing (short paper)
Andreas Schreiber, Tim Sonnekalb, Lynn von Kurnatowski
View presentation:2021-10-27T16:15:00ZGMT-0600Change your timezone on the schedule page
2021-10-27T16:15:00Z
Abstract
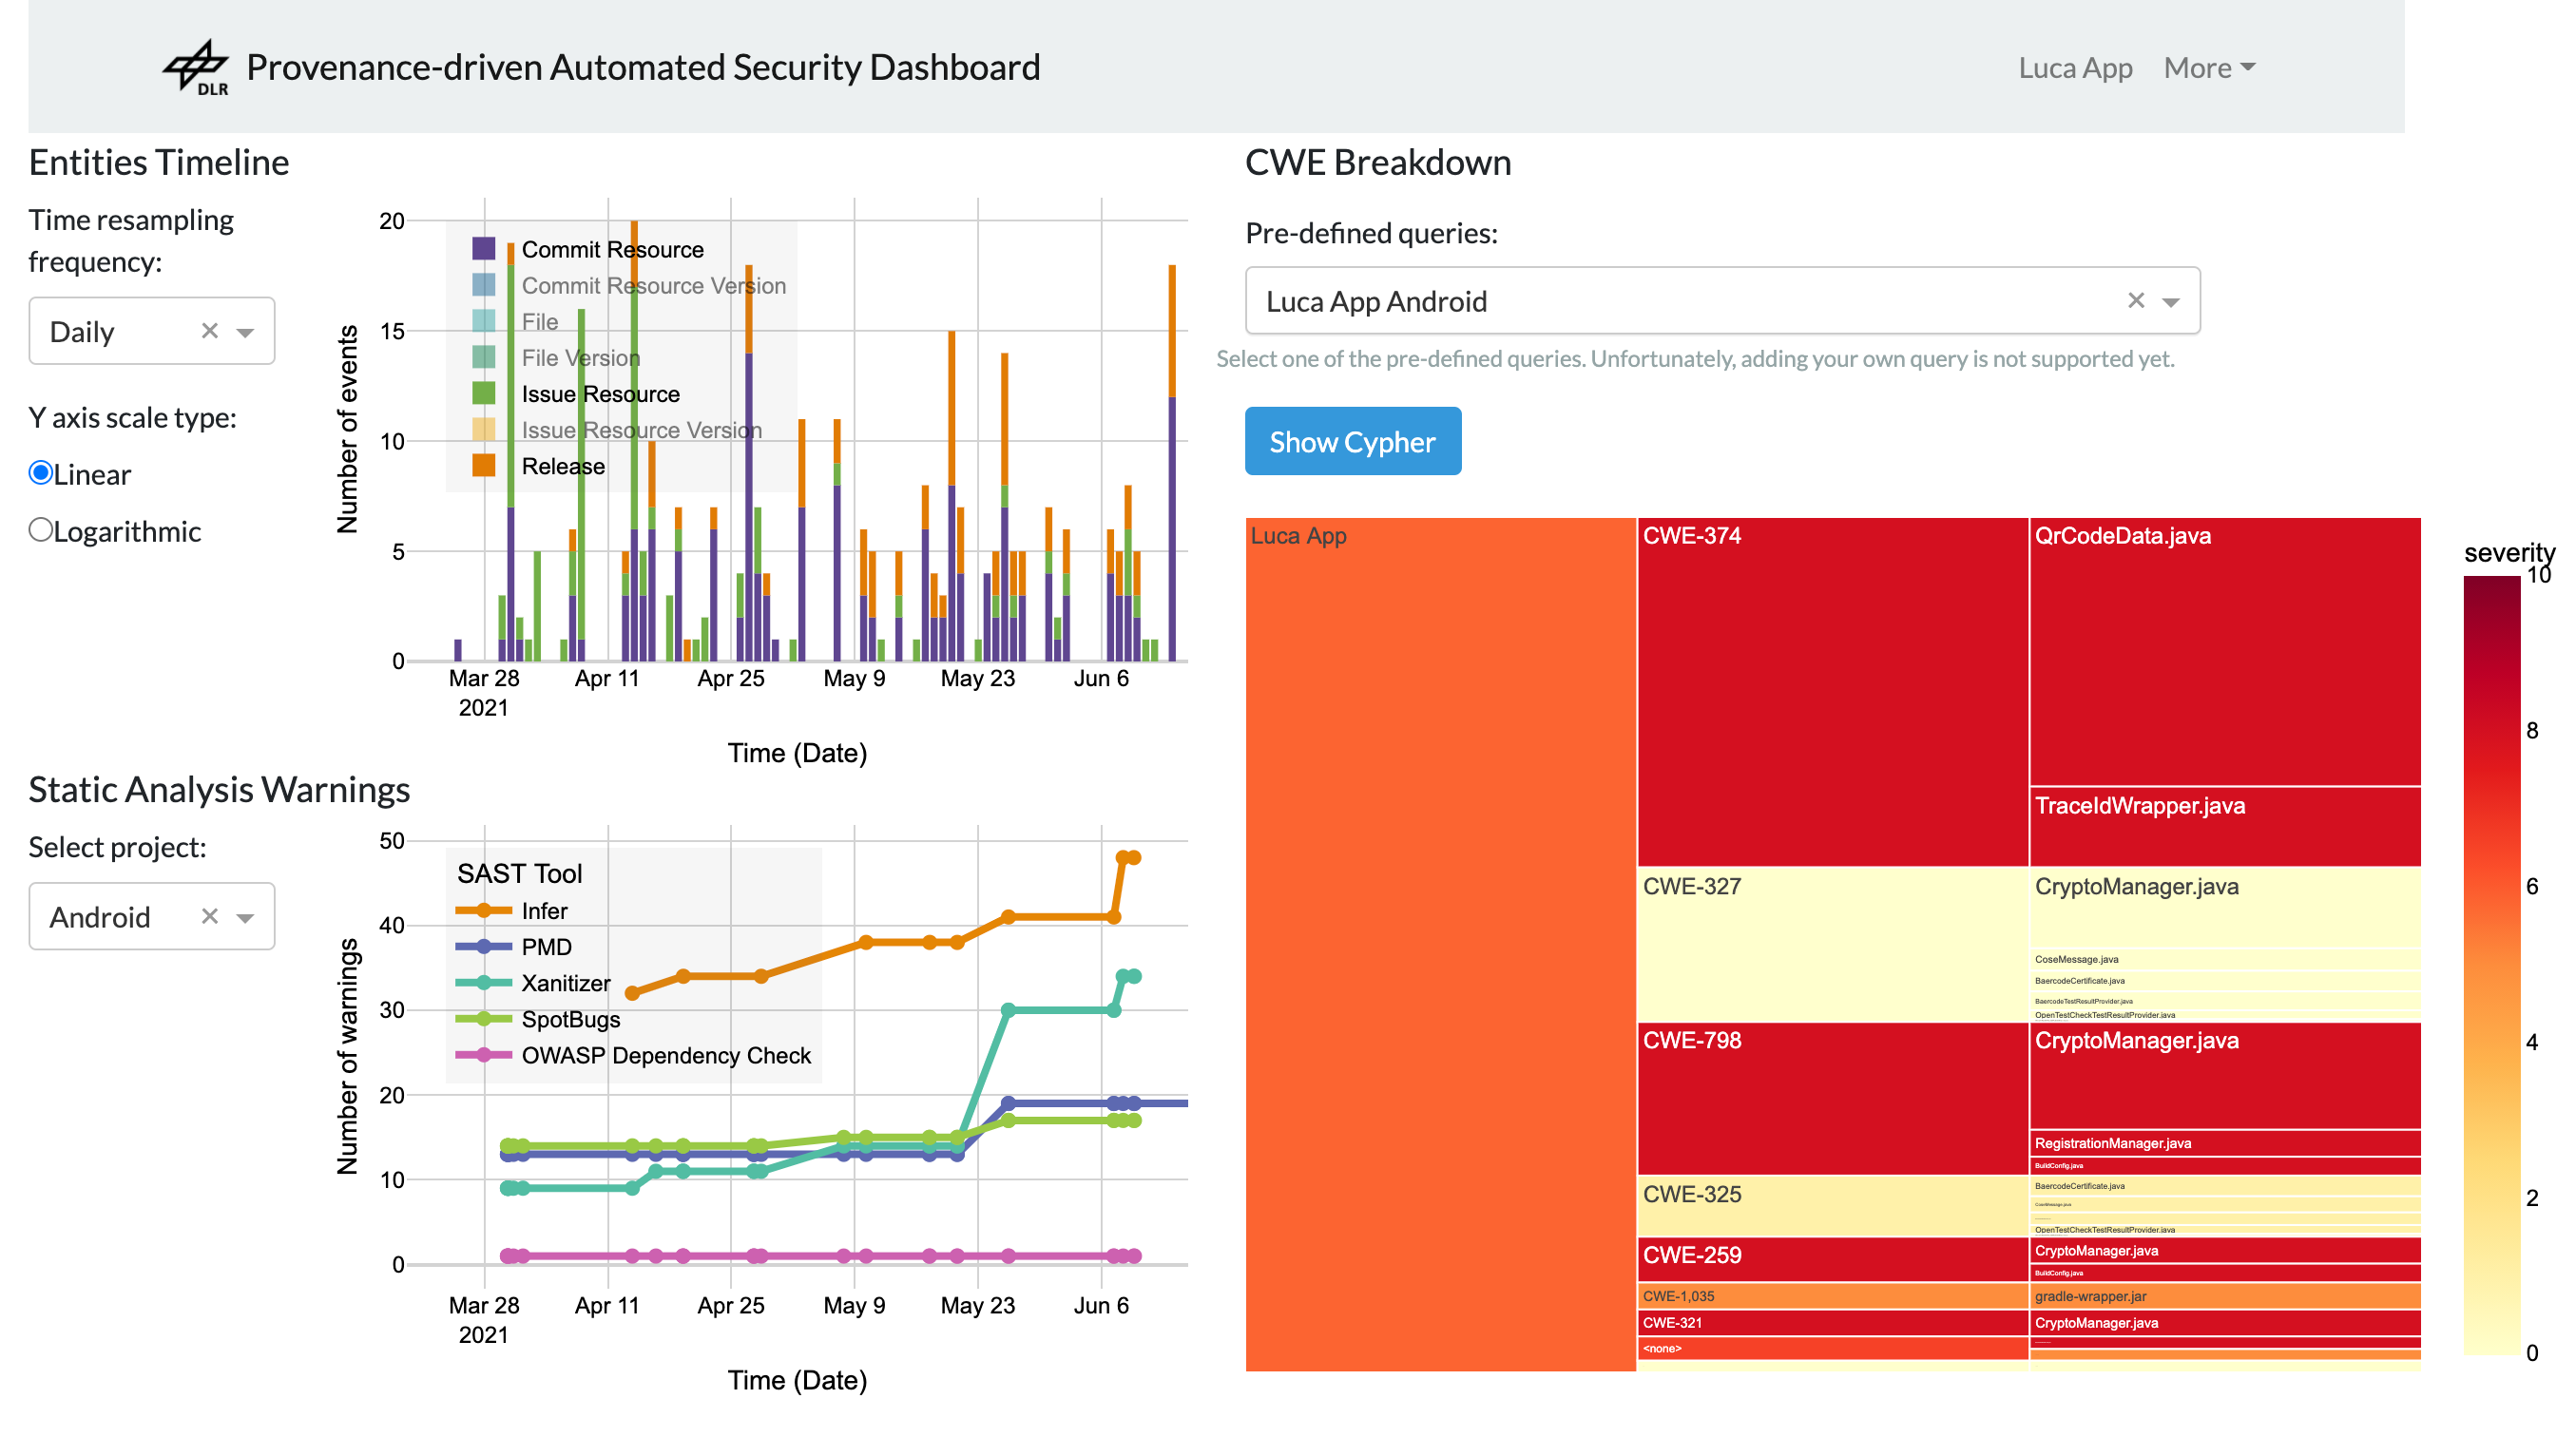
The use of static code analysis tools can be time consuming, as the many existing tools focus on different aspects and therefore development teams often use several of these tools to keep code quality high. Displaying the results of multiple tools, such as code smells and warnings, in a unified interface can help developers get a better overview and prioritize upcoming work. We present visualizations and a dashboard that interactively display results from static code analysis for “interesting” commits during development. With this, we aim to provide an effective visual analytics tool for code analysis results.