Dynamic 3D Visualization of Climate Model Development and Results
Jeremy Walton, Samantha Adams, Wolfgang Hayek, Piotr Florek, Harold Dyson
External link (DOI)
View presentation:2021-10-27T17:00:00ZGMT-0600Change your timezone on the schedule page
2021-10-27T17:00:00Z
Fast forward
Direct link to video on YouTube: https://youtu.be/OcscgKSYk_8
Abstract
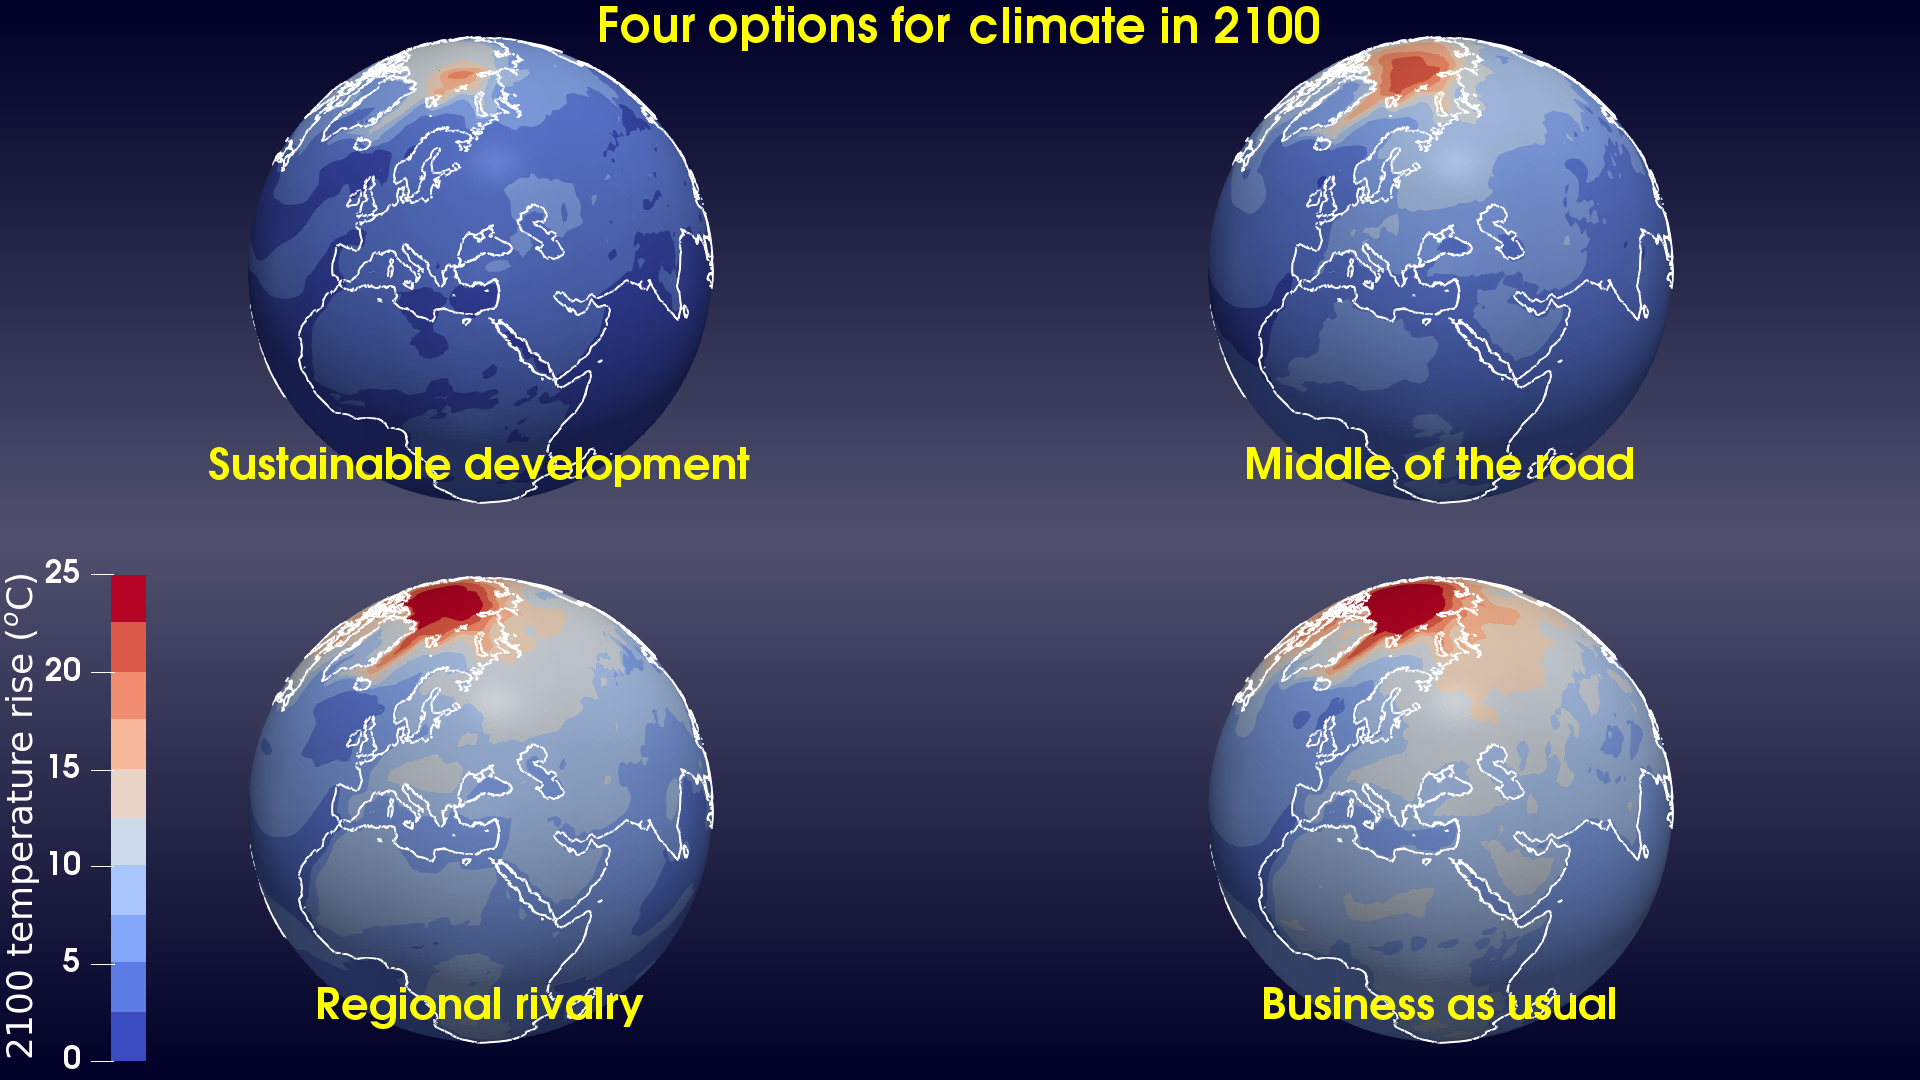
Climate models play a significant role in the understanding of climate change, and the effective presentation and interpretation of their results is important for both the scientific community and the general public. In the case of the latter audience-which has become increasingly concerned with the implications of climate change for society-there is a requirement for visualizations which are compelling and engaging. We describe the use of ParaView, a well-established visualization application, to produce images and animations of results from a large set of modeling experiments, and their use in the promulgation of climate research results. Visualization can also make useful contributions to development, particularly for complex large-scale applications such as climate models. We present early results from the construction of a next-generation climate model which has been designed for use on exascale compute platforms, and show how visualization has helped in the development process, particularly with regard to higher model resolutions and novel data representations.