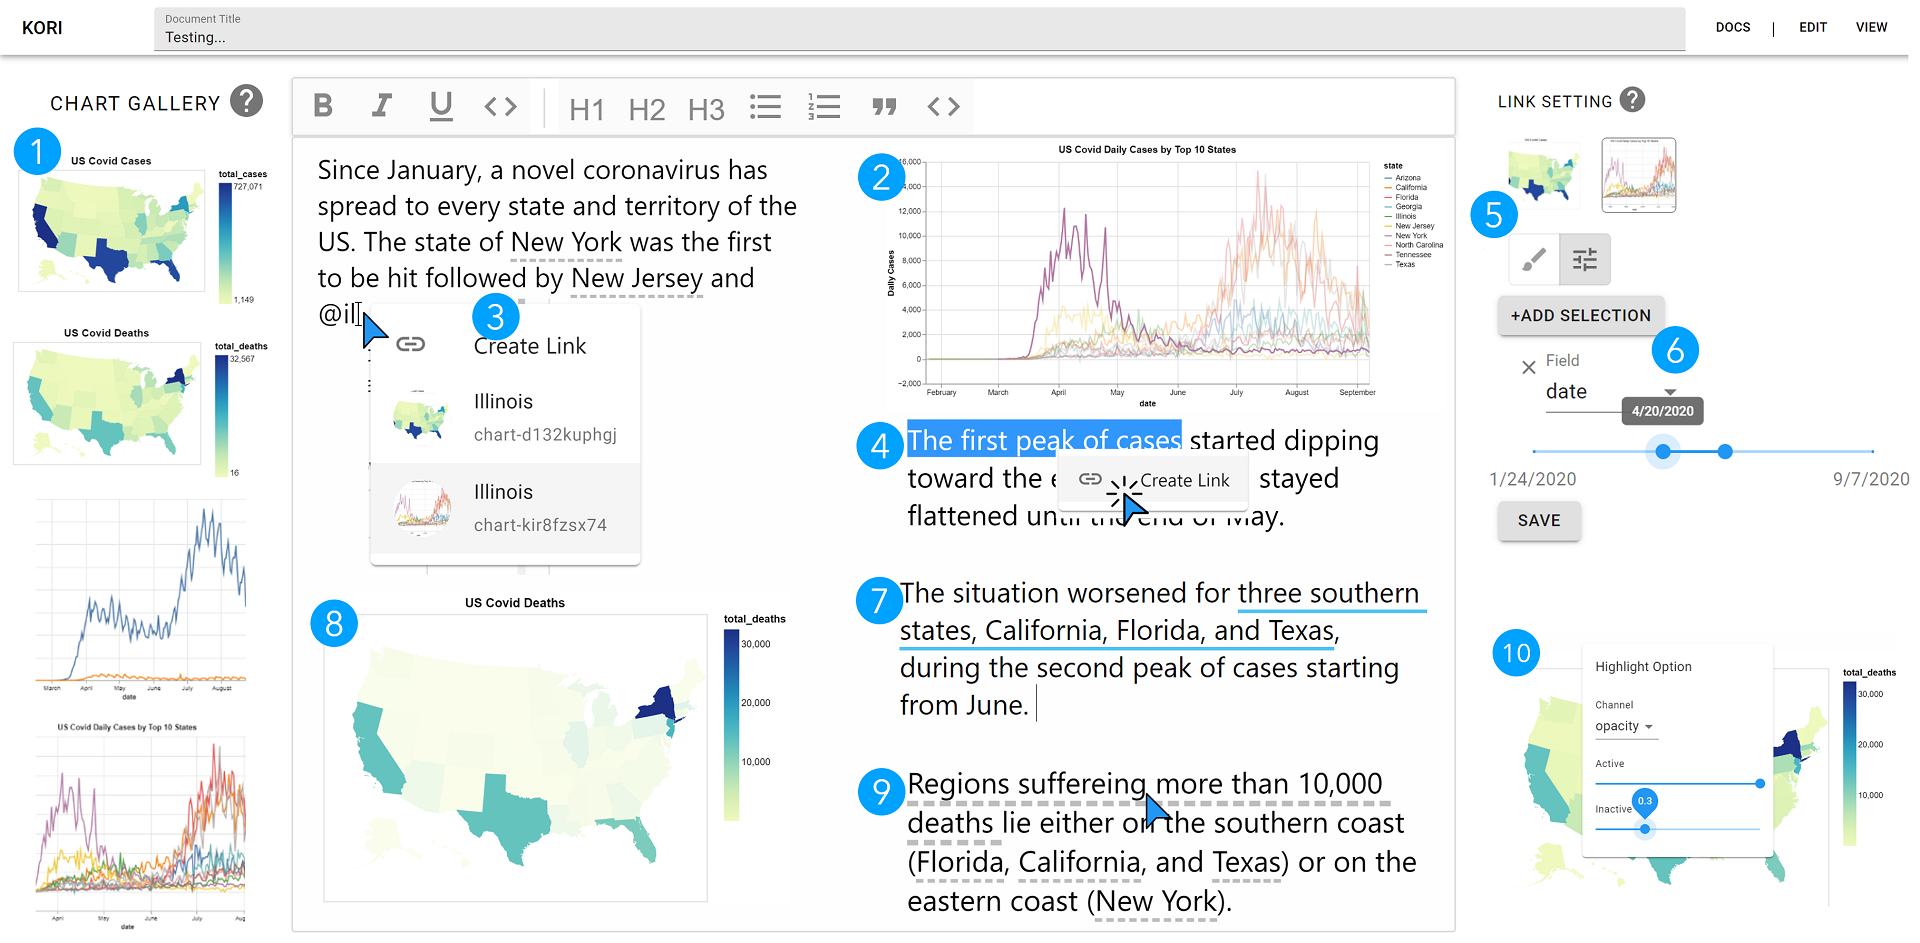
Kori: Interactive Synthesis of Text and Charts in Data Documents
Shahid Latif, Zheng Zhou, Yoon Kim, Fabian Beck, Nam Wook Kim
External link (DOI)
View presentation:2021-10-27T17:30:00ZGMT-0600Change your timezone on the schedule page
2021-10-27T17:30:00Z
Abstract
Charts go hand in hand with text to communicate complex data and are widely adopted in news articles, online blogs, and academic papers. They provide graphical summaries of the data, while text explains the message and context. However, synthesizing information across text and charts is difficult; it requires readers to frequently shift their attention. We investigated ways to support the tight coupling of text and charts in data documents. To understand their interplay, we analyzed the design space of such references through news articles and scientific papers. Informed by the analysis, we developed a mixed-initiative interface enabling users to construct interactive references between text and charts. It leverages natural language processing to automatically suggest references as well as allows users to manually construct other references effortlessly. A user study complemented with algorithmic evaluation of the system suggests that the interface provides an effective way to compose interactive data documents.