Improving Visualization Interpretation Using Counterfactuals
Smiti Kaul, David Borland, Nan Cao, David Gotz
External link (DOI)
View presentation:2021-10-28T18:00:00ZGMT-0600Change your timezone on the schedule page
2021-10-28T18:00:00Z
Abstract
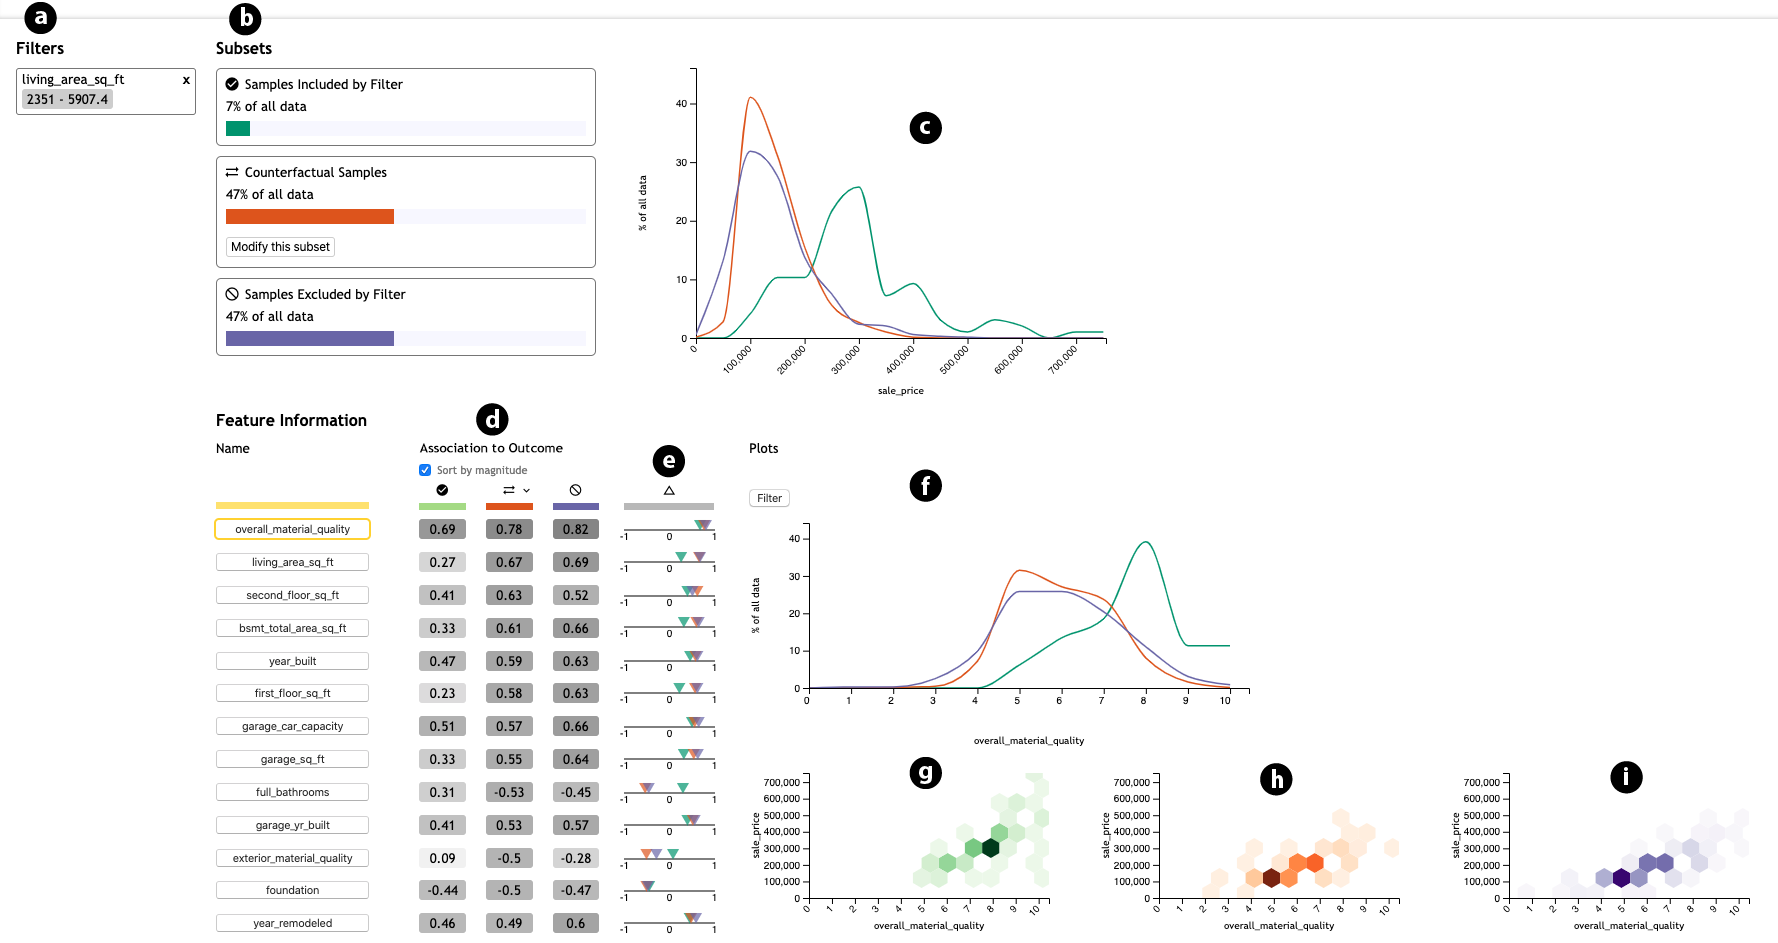
Complex, high-dimensional data is used in a wide range of domains to explore problems and make decisions. Analysis of high-dimensional data, however, is vulnerable to the hidden influence of confounding variables, especially as users apply ad hoc filtering operations to visualize only specific subsets of an entire dataset. Thus, visual data-driven analysis can mislead users and encourage mistaken assumptions about causality or the strength of relationships between features. This work introduces a novel visual approach designed to reveal the presence of confounding variables via counterfactual possibilities during visual data analysis. It is implemented in CoFact, an interactive visualization prototype that determines and visualizes counterfactual subsets to better support user exploration of feature relationships. Using publicly available datasets, we conducted a controlled user study to demonstrate the effectiveness of our approach; the results indicate that users exposed to counterfactual visualizations formed more careful judgments about feature-to-outcome relationships.