Propagating Visual Designs to Numerous Plots and Dashboards
Saiful Khan, Phong Nguyen, Alfie Abdul-Rahman, Benjamin Bach, Min Chen, Euan Freeman, Cagatay Turkay
External link (DOI)
View presentation:2021-10-27T17:00:00ZGMT-0600Change your timezone on the schedule page
2021-10-27T17:00:00Z
Fast forward
Direct link to video on YouTube: https://youtu.be/WVsrMdvjQlk
Abstract
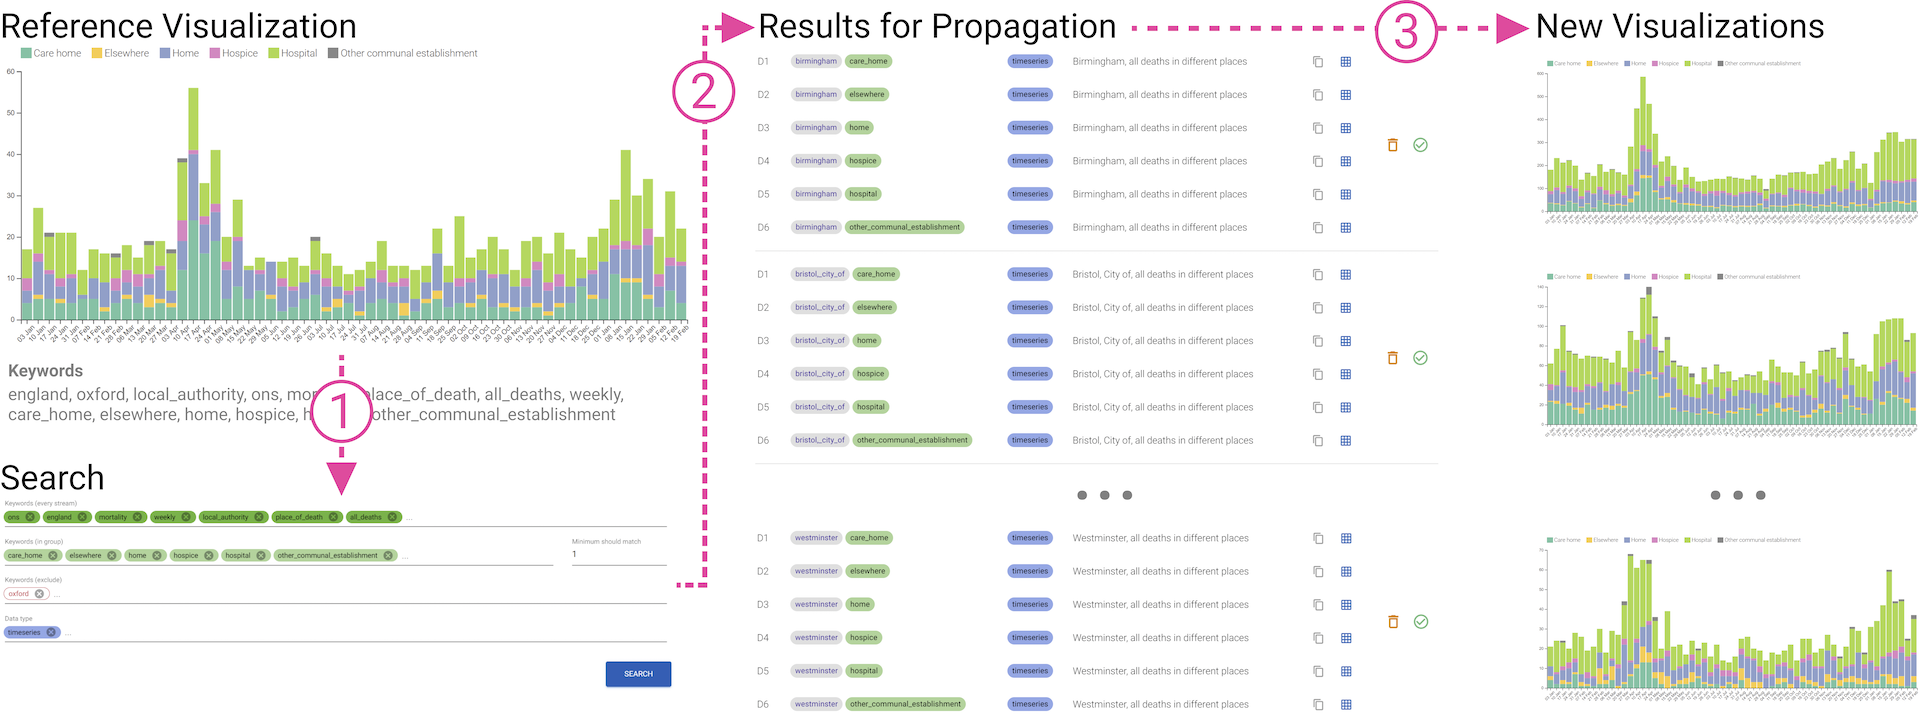
In the process of developing an infrastructure for providing visualization and visual analytics (VIS) tools to epidemiologists and modeling scientists, we encountered a technical challenge for applying a number of visual designs to numerous datasets rapidly and reliably with limited development resources. In this paper, we present a technical solution to address this challenge. Operationally, we separate the tasks of data management, visual designs, and plots and dashboard deployment in order to streamline the development workflow. Technically, we utilize: an ontology to bring datasets, visual designs, and deployable plots and dashboards under the same management framework; multi-criteria search and ranking algorithms for discovering potential datasets that match a visual design; and a purposely-design user interface for propagating each visual design to appropriate datasets (often in tens and hundreds) and quality-assuring the propagation before the deployment. This technical solution has been used in the development of the RAMPVIS infrastructure for supporting a consortium of epidemiologists and modeling scientists through visualization.