Towards Understanding Sensory Substitution for Accessible Visualization: An Interview Study
Pramod Chundury, Biswaksen Patnaik, Yasmin Reyazuddin, Christine Tang, Jonathan Lazar, Niklas Elmqvist
External link (DOI)
View presentation:2021-10-28T13:15:00ZGMT-0600Change your timezone on the schedule page
2021-10-28T13:15:00Z
Abstract
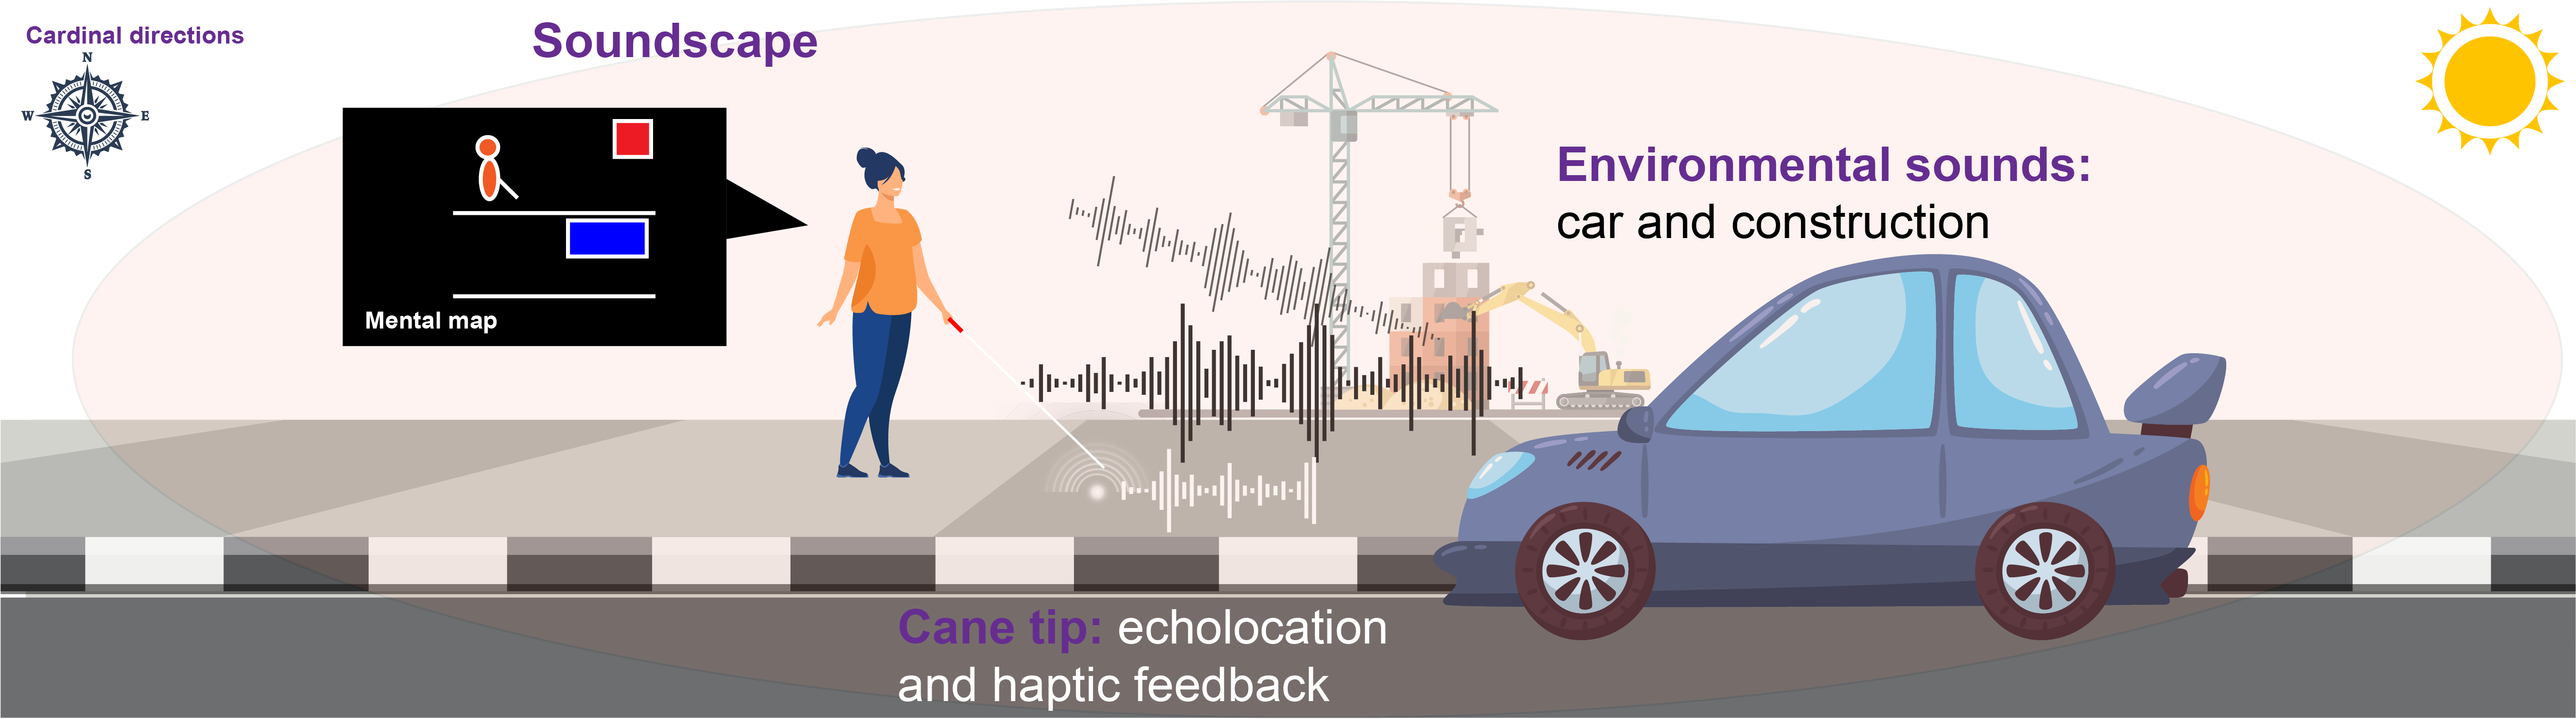
For all its potential in supporting data analysis, particularly in exploratory situations, visualization also creates barriers: accessibility for blind and visually impaired individuals. Regardless of how effective a visualization is, providing equal access for blind users requires a paradigm shift for the visualization research community. To enact such a shift, it is not sufficient to treat visualization accessibility as merely another technical problem to overcome. Instead, supporting the millions of blind and visually impaired users around the world who have equally valid needs for data analysis as sighted individuals requires a respectful, equitable, and holistic approach that includes all users from the onset. In this paper, we draw on accessibility research methodologies to make inroads towards such an approach. We first identify the people who have specific insight into how blind people perceive the world: orientation and mobility (O&M) experts, who are instructors that teach blind individuals how to navigate the physical world using non-visual senses. We interview 10 O&M experts—all of them blind—to understand how best to use sensory substitution other than the visual sense for conveying spatial layouts. Finally, we investigate our qualitative findings using thematic analysis. While blind people in general tend to use both sound and touch to understand their surroundings, we focused on auditory affordances and how they can be used to make data visualizations accessible—using sonification and auralization. However, our experts recommended supporting a combination of senses—sound and touch—to make charts accessible as blind individuals may be more familiar with exploring tactile charts. We report results on both sound and touch affordances, and conclude by discussing implications for accessible visualization for blind individuals.