An Automated Approach to Reasoning About Task-Oriented Insights in Responsive Visualization
Hyeok Kim, Ryan Rossi, Abhraneel Sarma, Dominik Moritz, Jessica Hullman
External link (DOI)
View presentation:2021-10-27T18:15:00ZGMT-0600Change your timezone on the schedule page
2021-10-27T18:15:00Z
Abstract
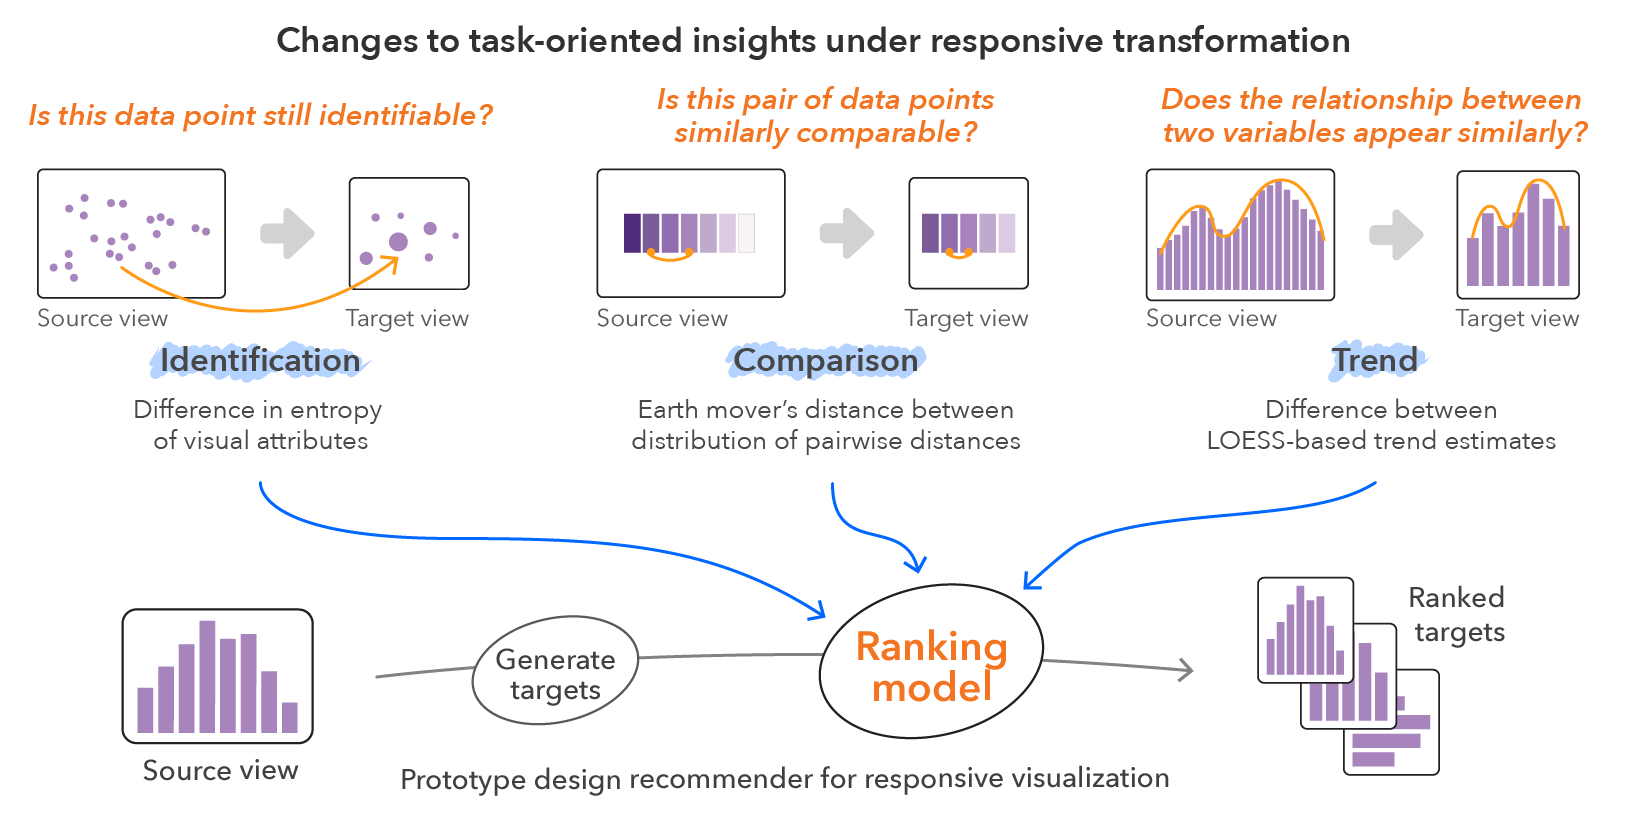
Authors often transform a large screen visualization for smaller displays through rescaling, aggregation and other techniques when creating visualizations for both desktop and mobile devices (i.e., responsive visualization). However, transformations can alter relationships or patterns implied by the large screen view, requiring authors to reason carefully about what information to preserve while adjusting their design for the smaller display. We propose an automated approach to approximating the loss of support for task-oriented visualization insights (identification, comparison, and trend) in responsive transformation of a source visualization. We operationalize identification, comparison, and trend loss as objective functions calculated by comparing properties of the rendered source visualization to each realized target (small screen) visualization. To evaluate the utility of our approach, we train machine learning models on human ranked small screen alternative visualizations across a set of source visualizations. We find that our approach achieves an accuracy of 84% (random forest model) in ranking visualizations. We demonstrate this approach in a prototype responsive visualization recommender that enumerates responsive transformations using Answer Set Programming and evaluates the preservation of task-oriented insights using our loss measures. We discuss implications of our approach for the development of automated and semi-automated responsive visualization recommendation.