Visualizing Uncertainty in Probabilistic Graphs with Network Hypothetical Outcome Plots (NetHOPs)
Dongping Zhang, Eytan Adar, Jessica Hullman
External link (DOI)
View presentation:2021-10-29T13:00:00ZGMT-0600Change your timezone on the schedule page
2021-10-29T13:00:00Z
Abstract
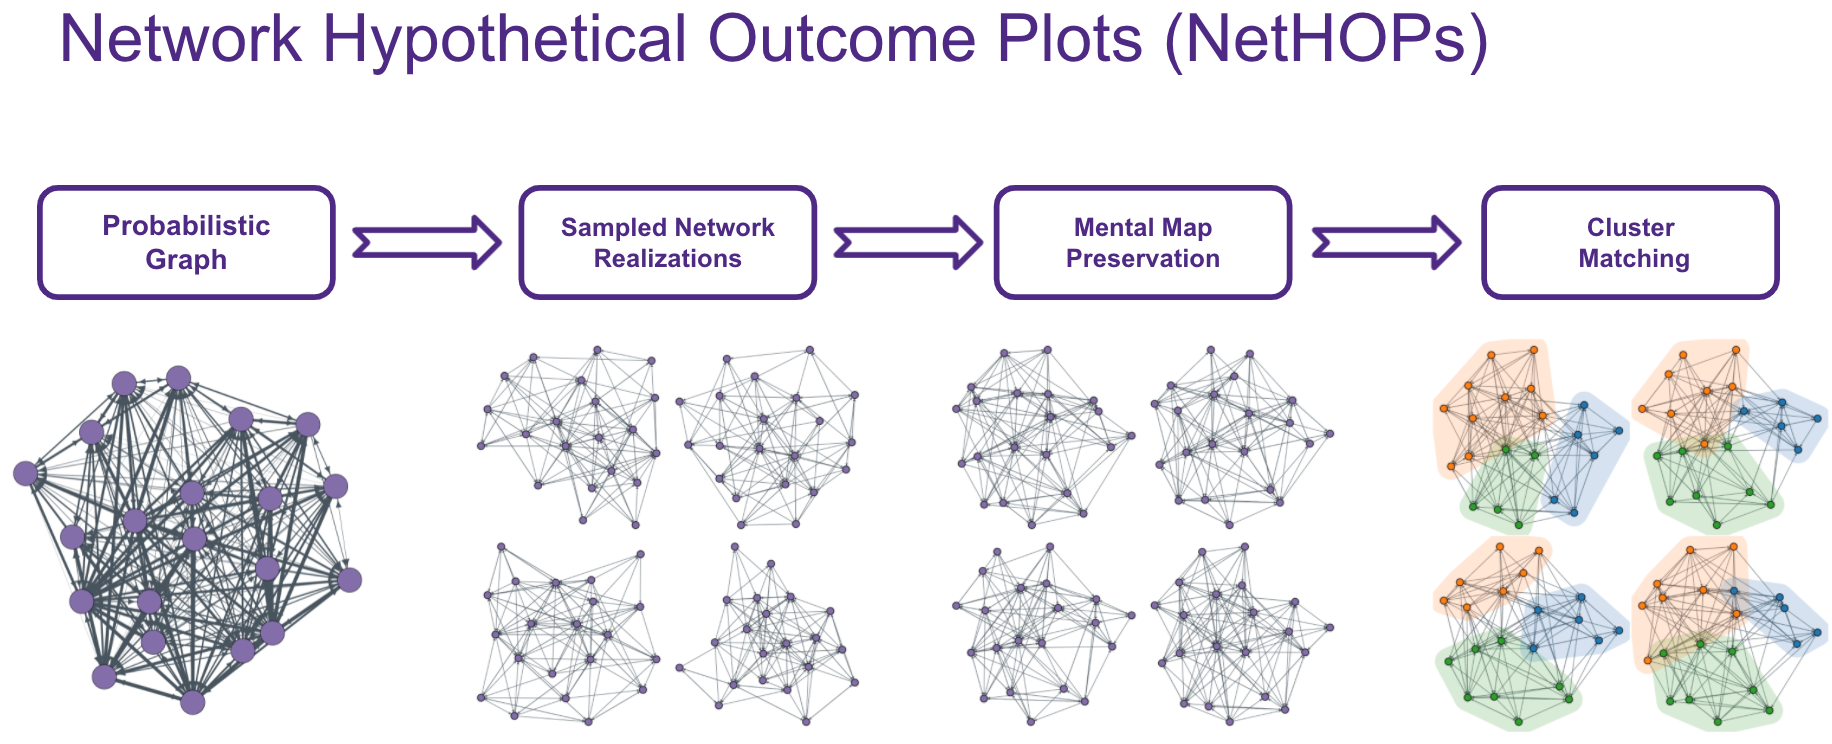
Probabilistic networks are challenging to visualize using the traditional node-link diagram. Encoding edge probability using visual variables like width or fuzziness makes it difficult for users of static network visualizations to estimate network statistics like densities, isolates, path lengths, or clustering under uncertainty. We introduce Network Hypothetical Outcome Plots (NetHOPs), a visualization technique that animates a sequence of network realizations sampled from a network distribution defined by probabilistic edges. NetHOPs employ an aggregation and anchoring algorithm used in dynamic and longitudinal graph drawing to parameterize layout stability to support uncertainty estimation. We present a community matching algorithm we developed to enable visualizing the uncertainty of cluster membership and community occurrence. We describe the results of a study in which 51 network experts used NetHOPs to complete a set of common visual analysis tasks and reported how they perceived network structures and properties subject to uncertainty. Participants’ estimates fell, on average, within 11% of the ground truth statistics, suggesting NetHOPs can be a reasonable approach for enabling network analysts to reason about multiple properties under uncertainty. Participants appeared able to articulate the distribution of network statistics slightly more accurately when they could manipulate the layout anchoring and the animation speed. Based on these findings, we synthesize design recommendations for developing and using animated network visualizations for probabilistic networks.