Pyramid-based Scatterplots Sampling for Progressive and Streaming Data Visualization
Xin Chen, Jian Zhang, Chi-Wing Fu, Jean-Daniel Fekete, Yunhai Wang
External link (DOI)
View presentation:2021-10-28T16:15:00ZGMT-0600Change your timezone on the schedule page
2021-10-28T16:15:00Z
Fast forward
Direct link to video on YouTube: https://youtu.be/_dj2w4nAqfs
Abstract
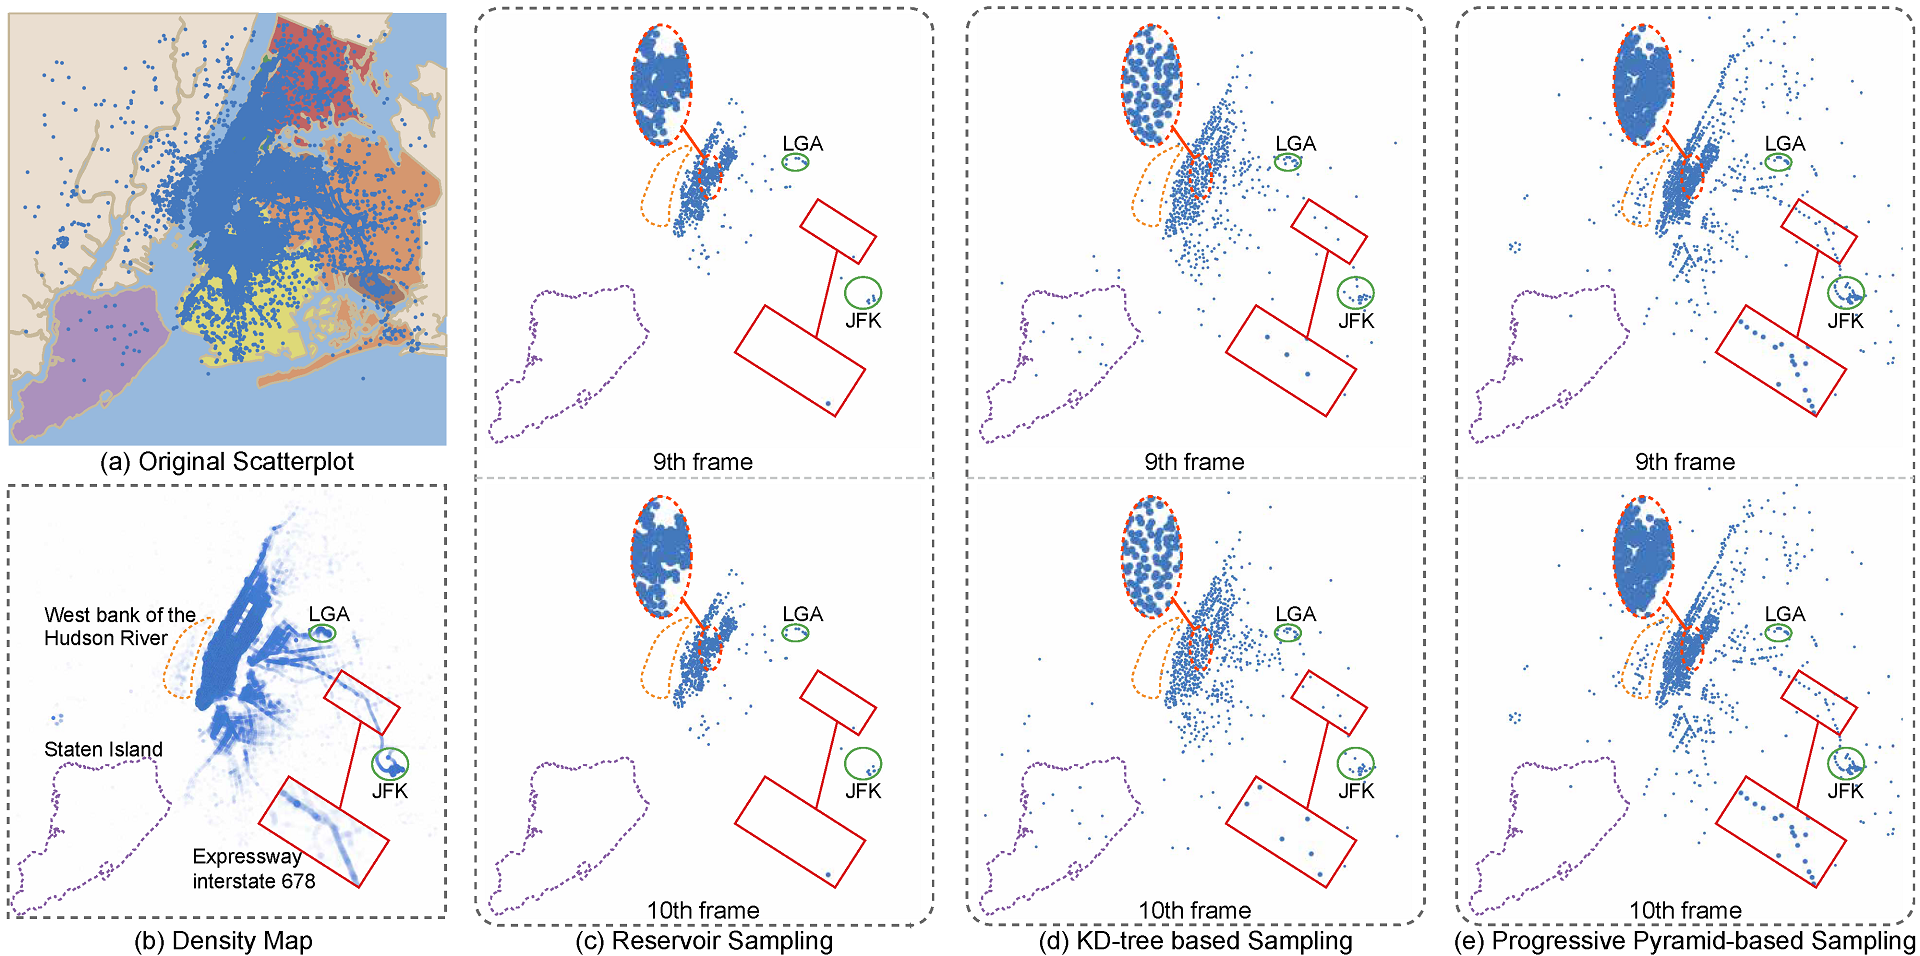
We present a pyramid-based scatterplot sampling technique to avoid overplotting and enable progressive and streaming visualization of large data. Our technique is based on a multiresolution pyramid-based decomposition of the underlying density map and makes use of the density values in the pyramid to guide the sampling at each scale for preserving the relative data densities and outliers. We show that our technique is competitive in quality with state-of-the-art methods and runs faster by about an order of magnitude. Also, we have adapted it to deliver progressive and streaming data visualization by processing the data in chunks and updating the scatterplot areas with visible changes in the density map. A quantitative evaluation shows that our approach generates stable and faithful progressive samples that are comparable to the state-of-the-art method in preserving relative densities and superior to it in keeping outliers and stability when switching frames. We present two case studies that demonstrate the effectiveness of our approach for exploring large data.