Honorable Mention
Rethinking the Ranks of Visual Channels
Caitlyn McColeman, Fumeng Yang, Timothy F. Brady, Steven Franconeri
External link (DOI)
View presentation:2021-10-27T13:30:00ZGMT-0600Change your timezone on the schedule page
2021-10-27T13:30:00Z
Abstract
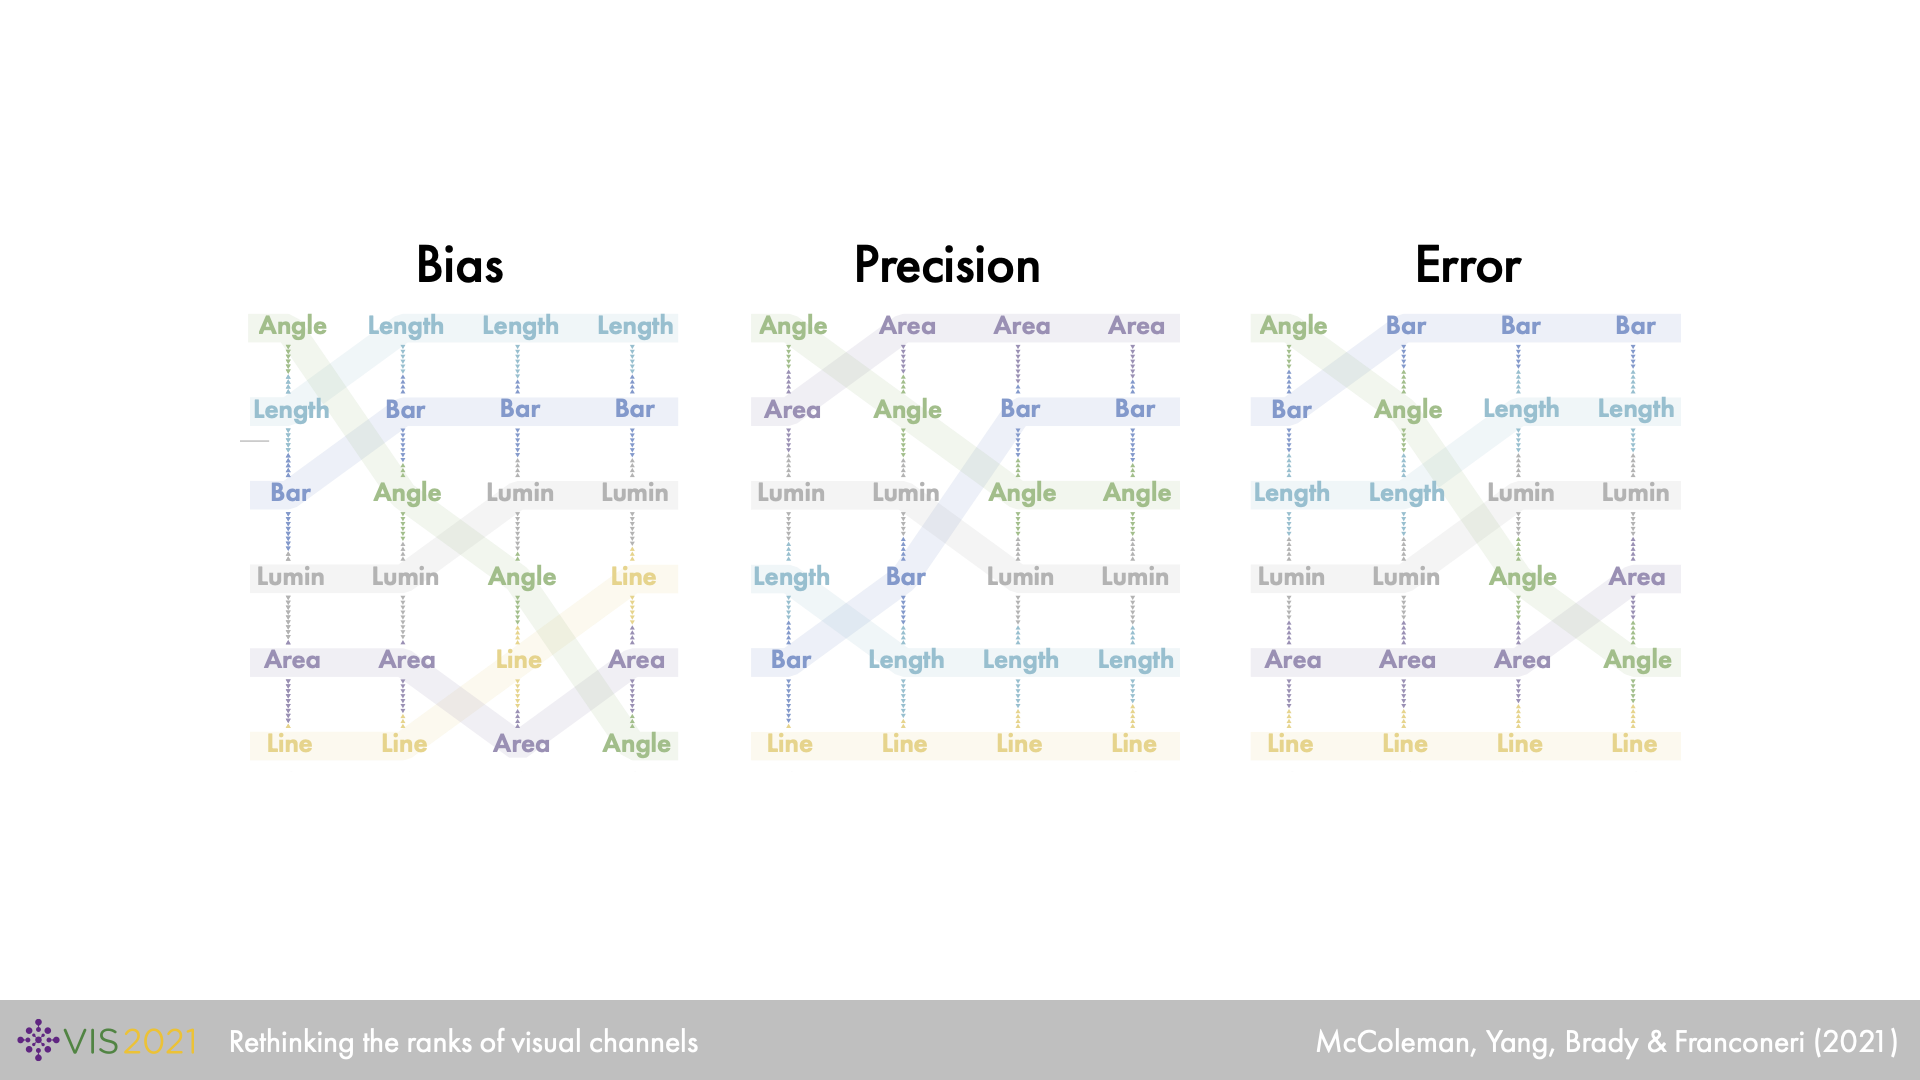
Data can be visually represented using visual channels like position, length or luminance. An existing ranking of these visual channels is based on how accurately participants could report the ratio between two depicted values. There is an assumption that this ranking should hold for different tasks and for different numbers of marks. However, there is surprisingly little existing work that tests this assumption, especially given that visually computing ratios is relatively unimportant in real-world visualizations, compared to seeing, remembering, and comparing trends and motifs, across displays that almost universally depict more than two values. To simulate the information extracted from a glance at a visualization, we instead asked participants to immediately reproduce a set of values from memory after they were shown the visualization. These values could be shown in a bar graph (position (bar)), line graph (position (line)), heat map (luminance), bubble chart (area), misaligned bar graph (length), or ‘wind map’ (angle). With a Bayesian multilevel modeling approach, we observed how the relevant rank positions of visual channels shift across different numbers of marks (2, 4 or 8) and for bias, precision, and error measures. The ranking did not hold, even for reproductions of only 2 marks, and the new ranking was highly inconsistent for reproductions of different numbers of marks. Other factors besides channel choice had an order of magnitude more influence on performance, such as the number of values in the series (e.g., more marks led to larger errors), or the value of each mark (e.g., small values were systematically overestimated). Every visual channel was worse for displays with 8 marks than 4, consistent with established limits on visual memory. These results point to the need for a body of empirical studies that move beyond two-value ratio judgments as a baseline for ranking the quality of a visual channel, including testing new tasks (detection of trends or motifs), timescales (immediate computation, or later comparison), and the number of values (from a handful, to thousands).