Accessible Visualization via Natural Language Descriptions: A Four-Level Model of Semantic Content
Alan Lundgard, Arvind Satyanarayan
External link (DOI)
View presentation:2021-10-28T13:00:00ZGMT-0600Change your timezone on the schedule page
2021-10-28T13:00:00Z
Abstract
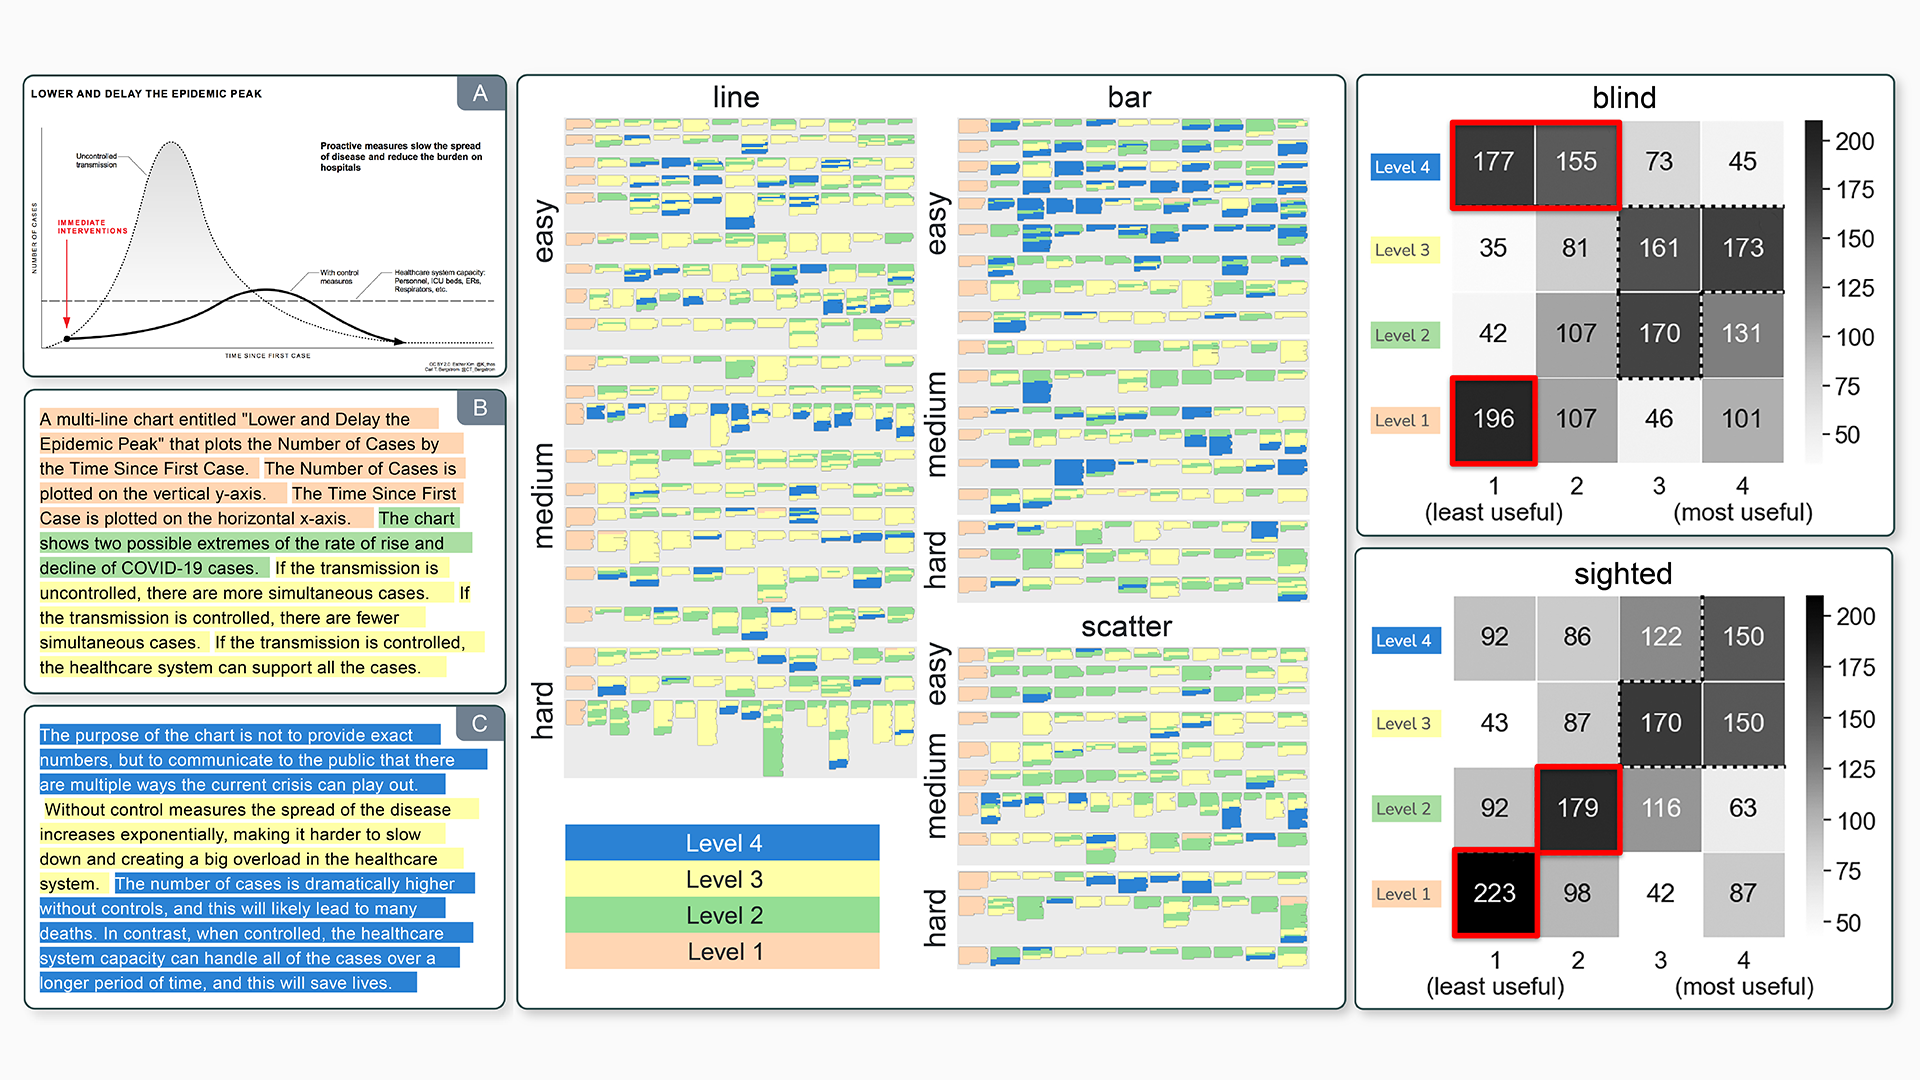
Natural language descriptions sometimes accompany visualizations to better communicate and contextualize their insights, and to improve their accessibility for readers with disabilities. However, it is difficult to evaluate the usefulness of these descriptions, and how effectively they improve access to meaningful information, because we have little understanding of the semantic content they convey, and how different readers receive this content. In response, we introduce a conceptual model for the semantic content conveyed by natural language descriptions of visualizations. Developed through a grounded theory analysis of 2,147 sentences, our model spans four levels of semantic content: enumerating visualization construction properties (e.g., marks and encodings); reporting statistical concepts and relations (e.g., extrema and correlations); identifying perceptual and cognitive phenomena (e.g., complex trends and patterns); and elucidating domain-specific insights (e.g., social and political context). To demonstrate how our model can be applied to evaluate the effectiveness of visualization descriptions, we conduct a mixed-methods evaluation with 30 blind and 90 sighted readers, and find that these reader groups differ significantly on which semantic content they rank as most useful. Together, our model and findings suggest that access to meaningful information is strongly reader-specific, and that research in automatic visualization captioning should orient toward descriptions that more richly communicate overall trends and statistics, sensitive to reader preferences. Our work further opens a space of research on natural language as a data interface coequal with visualization.