KD-Box: Line-segment-based KD-tree for Interactive Exploration of Large-scale Time-Series Data
Yue Zhao, Jian Zhang, Chi-Wing Fu, Mingliang Xu, Dominik Moritz, Yunhai Wang
External link (DOI)
View presentation:2021-10-28T17:15:00ZGMT-0600Change your timezone on the schedule page
2021-10-28T17:15:00Z
Fast forward
Direct link to video on YouTube: https://youtu.be/zHiYTZUw5Co
Abstract
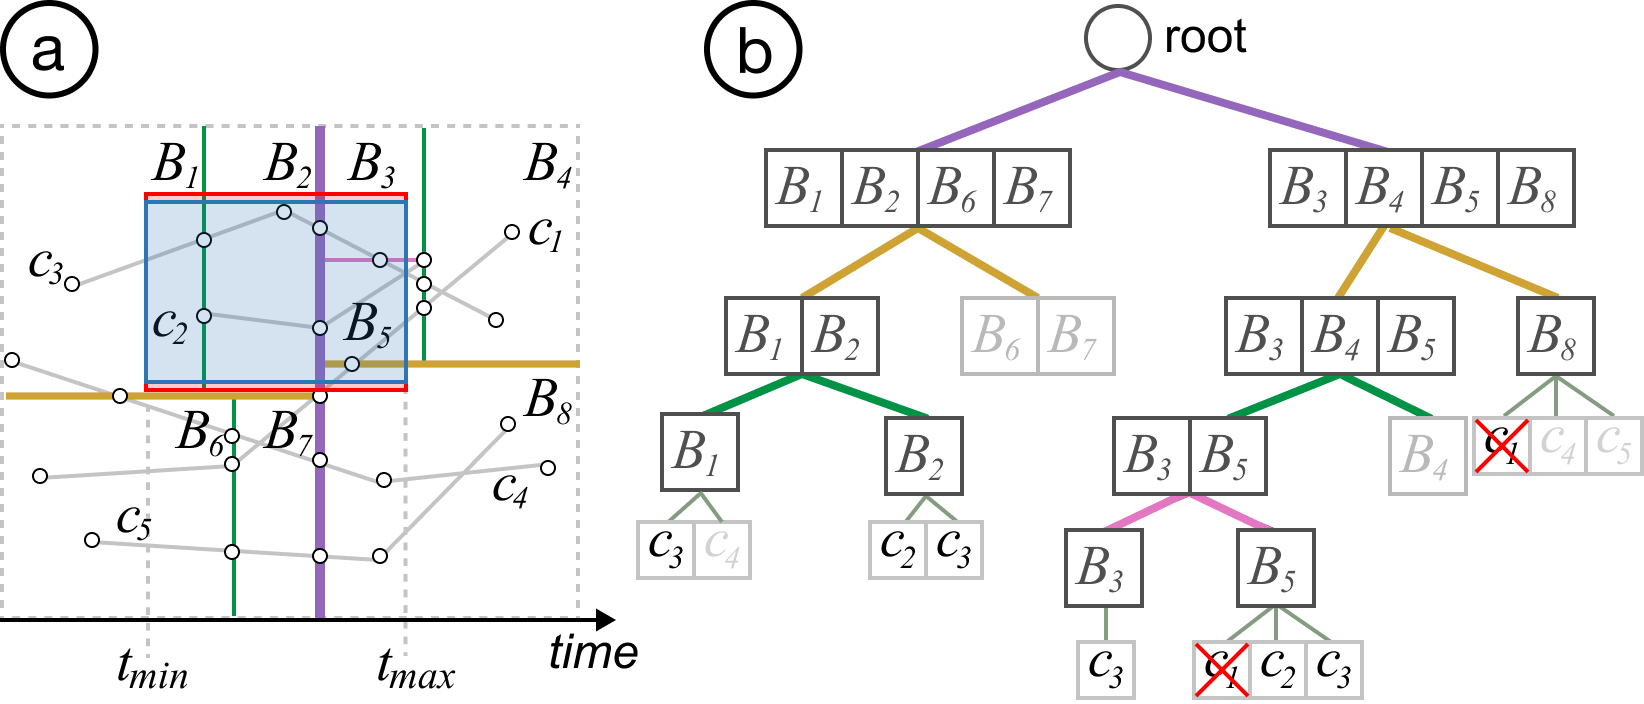
Time-series data—usually presented in the form of lines—plays an important role in many domains such as finance, meteorology, health, and urban informatics. Yet, little has been done to support interactive exploration of large-scale time-series data, which requires a clutter-free visual representation with low-latency interactions. In this paper, we contribute a novel line-segment-based KD-tree method to enable interactive analysis of many time series. Our method enables not only fast queries over time series in selected regions of interest but also a line splatting method for efficient computation of the density field and selection of representative lines. Further, we develop KD-Box, an interactive system that provides rich interactions, e.g., timebox, attribute filtering, and coordinated multiple views. We demonstrate the effectiveness of KD-Box in supporting efficient line query and density field computation through a quantitative comparison and show its usefulness for interactive visual analysis on several real-world datasets.