Honorable Mention
spEuler: Semantics-preserving Euler Diagrams
Rebecca Kehlbeck, Jochen Görtler, Yunhai Wang, Oliver Deussen
External link (DOI)
View presentation:2021-10-29T14:00:00ZGMT-0600Change your timezone on the schedule page
2021-10-29T14:00:00Z

Abstract
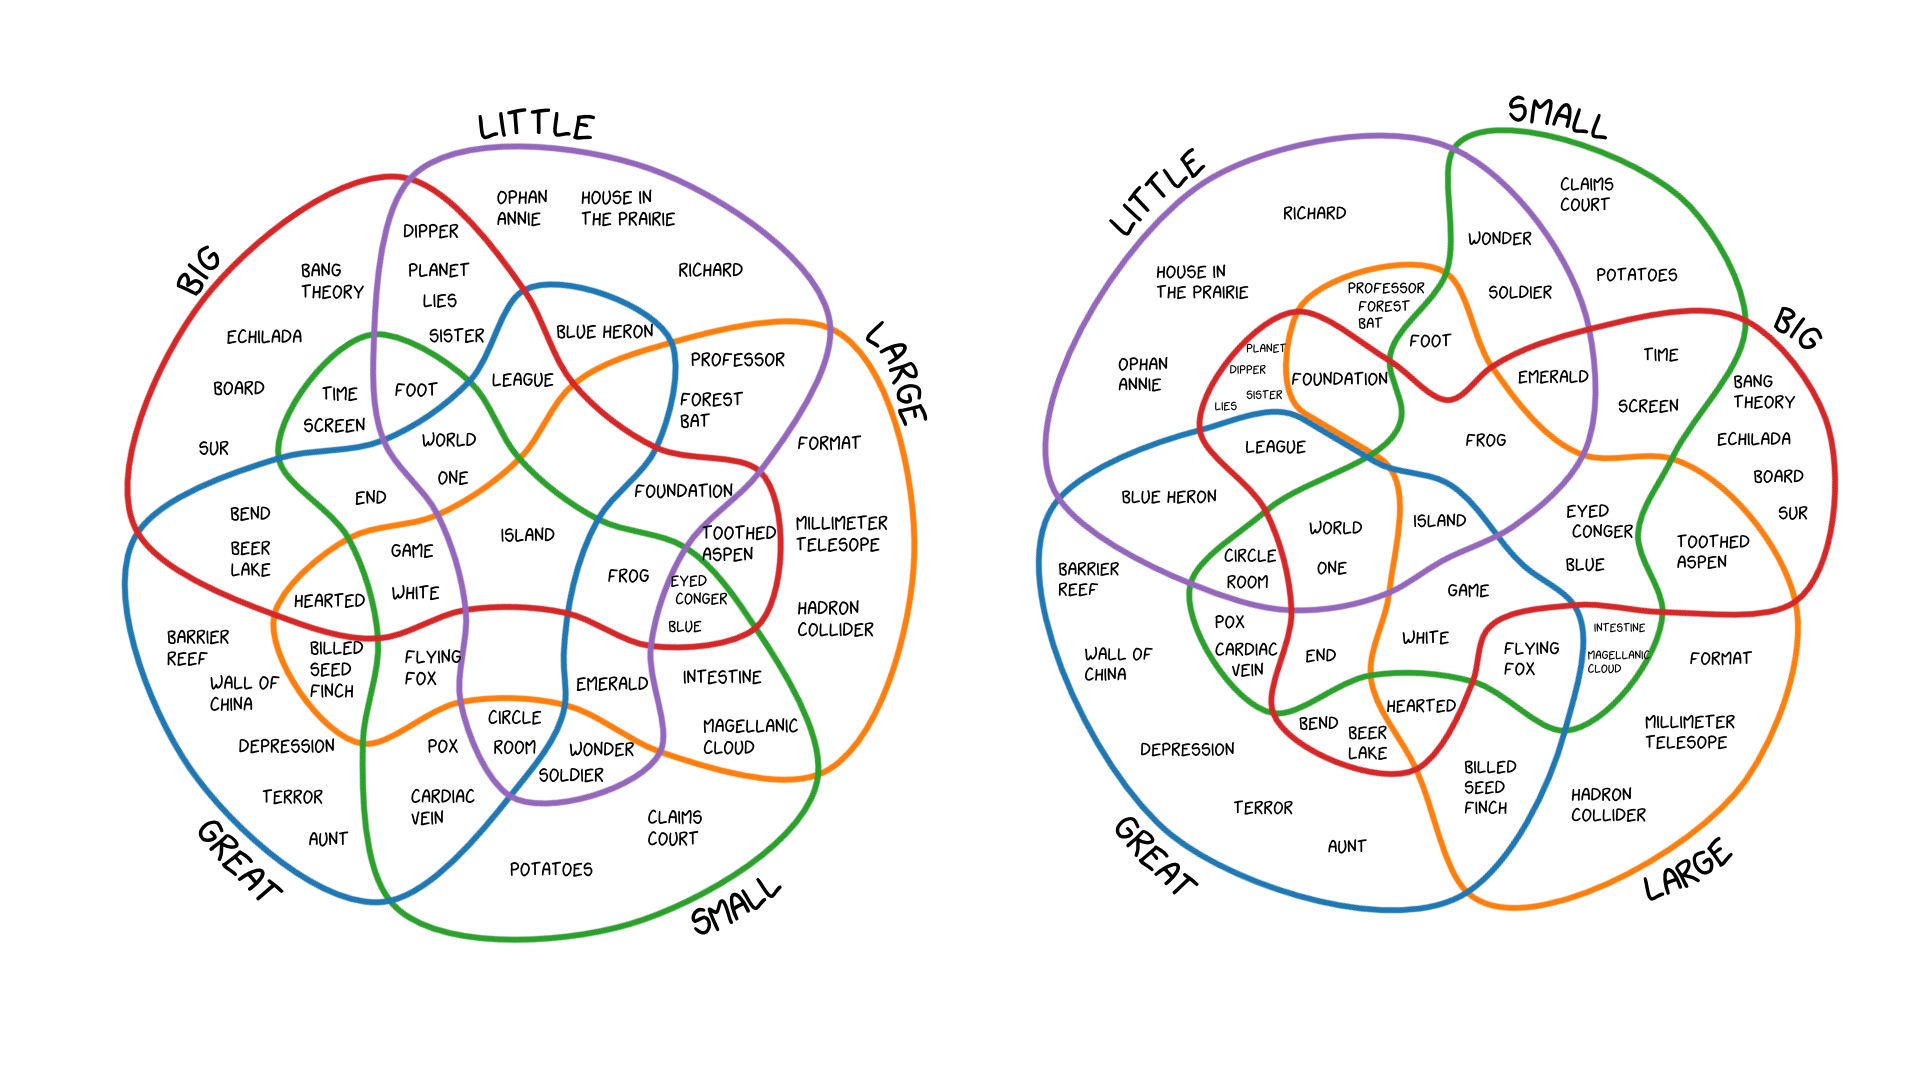
Creating comprehensible visualizations of highly overlapping set-typed data is a challenging task due to its complexity. To facilitate insights into set connectivity and to leverage semantic relations between intersections, we propose a fast two-step layout technique for Euler diagrams that are both well-matched and well-formed. Our method conforms to established form guidelines for Euler diagrams regarding semantics, aesthetics, and readability. First, we establish an initial ordering of the data, which we then use to incrementally create a planar, connected, and monotone dual graph representation. In the next step, the graph is transformed into a circular layout that maintains the semantics and yields simple Euler diagrams with smooth curves. When the data cannot be represented by simple diagrams, our algorithm always falls back to a solution that is not well-formed but still well-matched, whereas previous methods often fail to produce expected results. We show the usefulness of our method for visualizing set-typed data using examples from text analysis and infographics. Furthermore, we discuss the characteristics of our approach and evaluate our method against state-of-the-art methods.