Interactive Dimensionality Reduction for Comparative Analysis
Takanori Fujiwara, Xinhai Wei, Jian Zhao, Kwan-Liu Ma
External link (DOI)
View presentation:2021-10-27T14:15:00ZGMT-0600Change your timezone on the schedule page
2021-10-27T14:15:00Z
Abstract
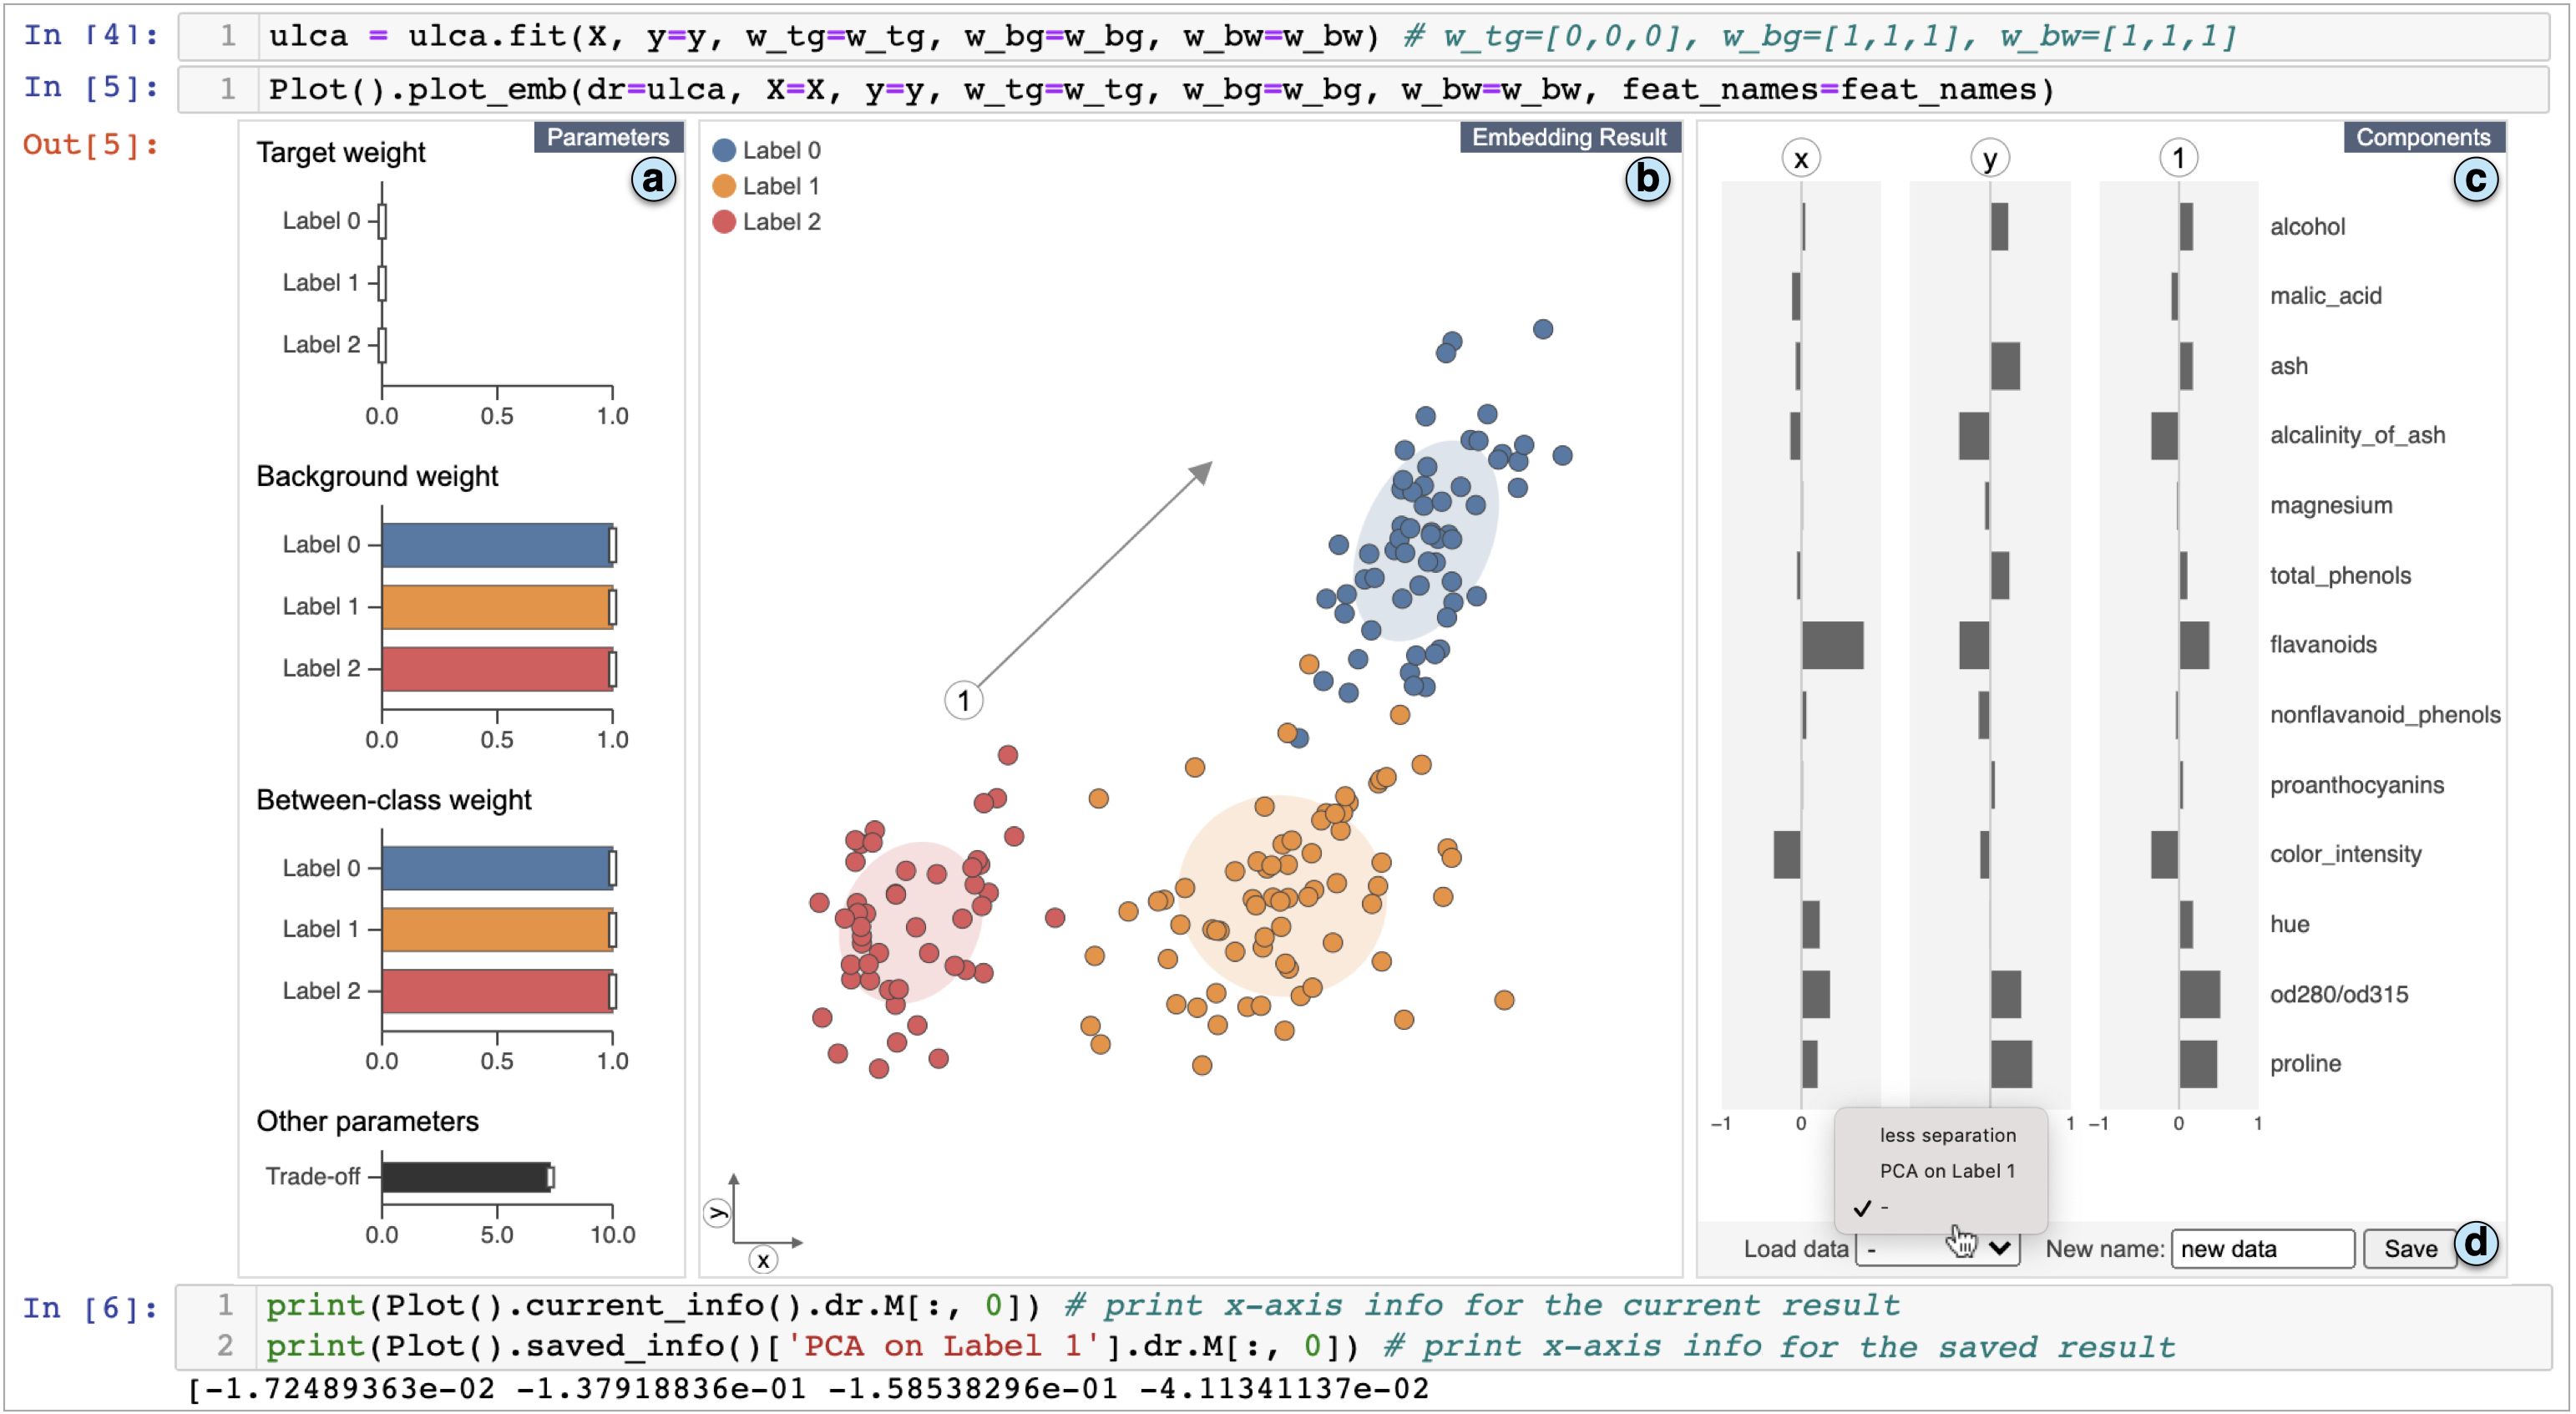
Finding the similarities and differences between two or more groups of datasets is a fundamental analysis task. For high-dimensional data, dimensionality reduction (DR) methods are often used to find the characteristics of each group. However, existing DR methods provide limited capability and flexibility for such comparative analysis as each method is designed only for a narrow analysis target, such as identifying factors that most differentiate groups. In this work, we introduce an interactive DR framework where we integrate our new DR method, called ULCA (unified linear comparative analysis), with an interactive visual interface. ULCA unifies two DR schemes, discriminant analysis and contrastive learning, to support various comparative analysis tasks. To provide flexibility for comparative analysis, we develop an optimization algorithm that enables analysts to interactively refine ULCA results. Additionally, we provide an interactive visualization interface to examine ULCA results with a rich set of analysis libraries. We evaluate ULCA and the optimization algorithm to show their efficiency as well as present multiple case studies using real-world datasets to demonstrate the usefulness of our framework.