Modeling Just Noticeable Differences in Charts
Min Lu, Joel Lanir, Chufeng Wang, Yucong Yao, Wen Zhang, Oliver Deussen, Hui Huang
External link (DOI)
View presentation:2021-10-27T14:00:00ZGMT-0600Change your timezone on the schedule page
2021-10-27T14:00:00Z
Abstract
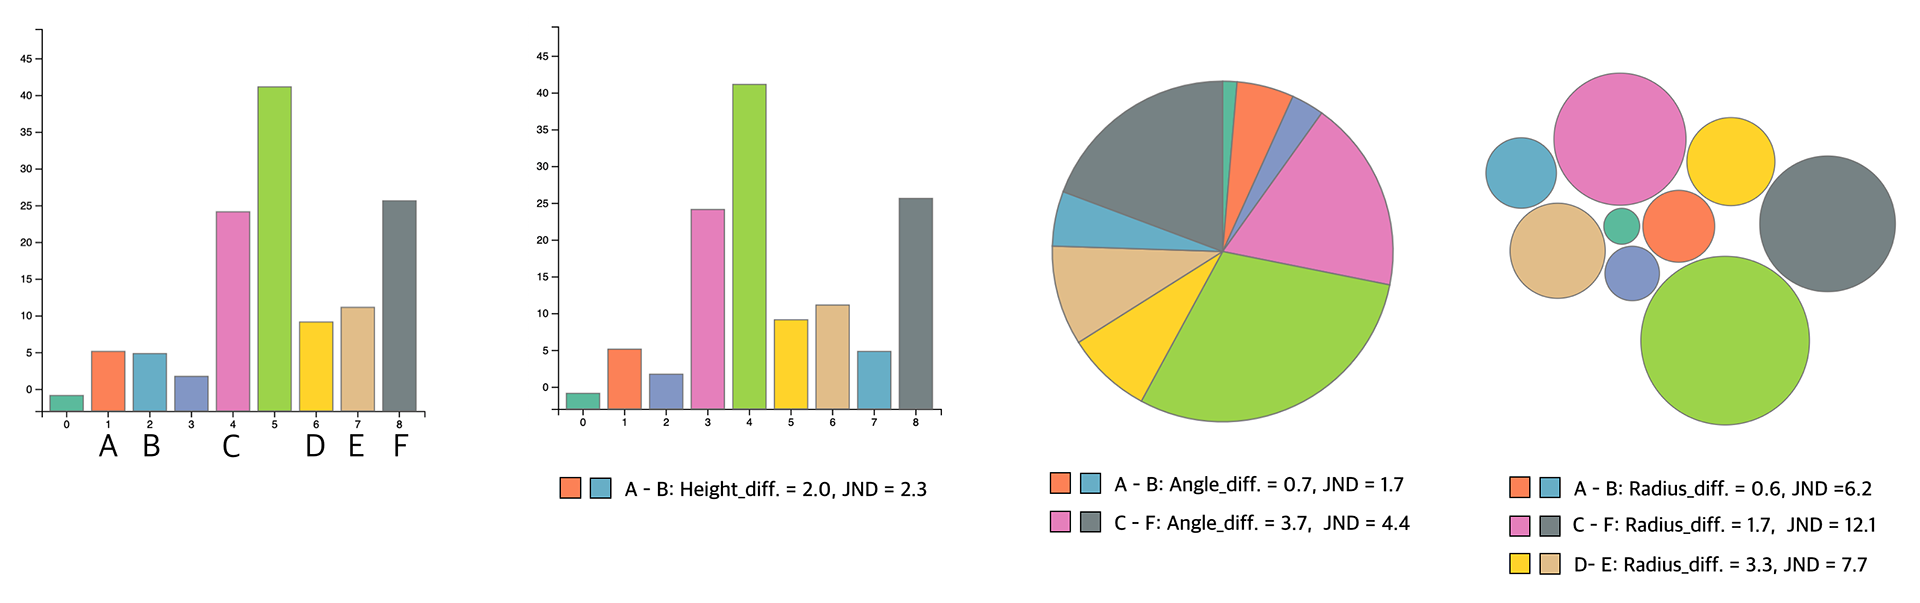
One of the fundamental tasks in visualization is to compare two or more visual elements. However, it is often difficult to visually differentiate graphical elements encoding a small difference in value, such as the heights of similar bars in bar chart or angles of similar sections in pie chart. Perceptual laws can be used in order to model when and how we perceive this difference. In this work, we model the perception of Just Noticeable Differences (JNDs), the minimum difference in visual attributes that allow faithfully comparing similar elements, in charts. Specifically, we explore the relation between JNDs and two major visual variables: the intensity of visual elements and the distance between them, and study it in three charts: bar chart, pie chart and bubble chart. Through an empirical study, we identify main effects on JND for distance in bar charts, intensity in pie charts, and both distance and intensity in bubble charts. By fitting a linear mixed effects model, we model JND and find that JND grows as the exponential function of variables. We highlight several usage scenarios that make use of the JND modeling in which elements below the fitted JND are detected and enhanced with secondary visual cues for better discrimination.