A Mixed-Initiative Approach to Reusing Infographic Charts
Weiwei Cui, Jinpeng Wang, He Huang, Yun Wang, Chin-Yew Lin, Haidong Zhang, Dongmei Zhang
External link (DOI)
View presentation:2021-10-27T17:15:00ZGMT-0600Change your timezone on the schedule page
2021-10-27T17:15:00Z
Abstract
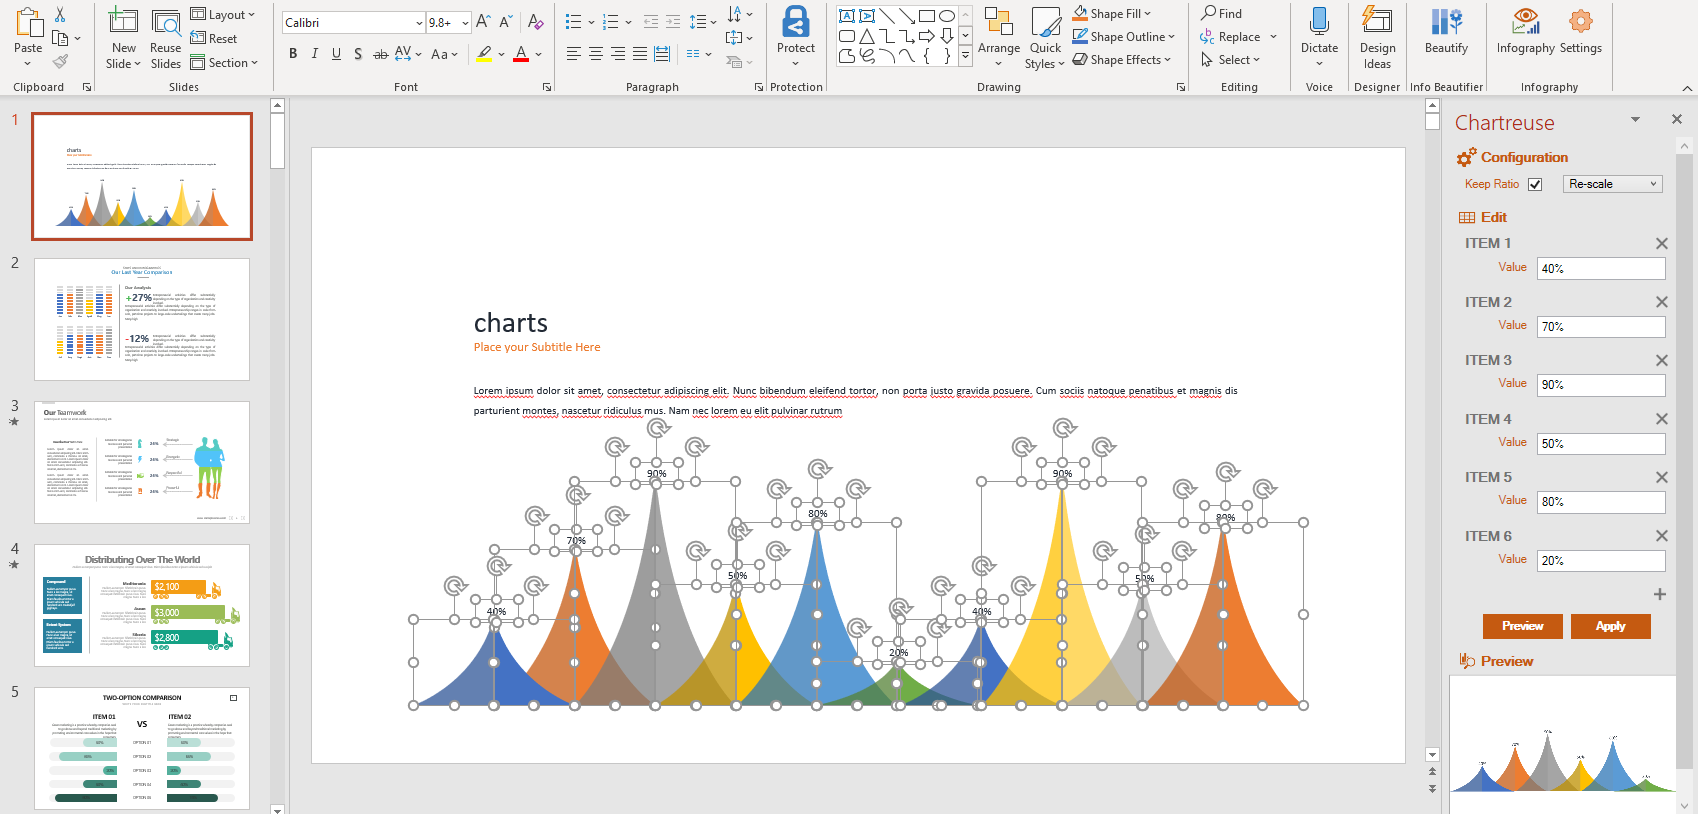
Infographic bar charts have been widely adopted for communicating numerical information because of their attractiveness and memorability. However, these infographics are often created manually with general tools, such as PowerPoint and Adobe Illustrator, and merely composed of primitive visual elements, such as text blocks and shapes. With the absence of chart models, updating or reusing these infographics requires tedious and error-prone manual edits. In this paper, we propose a mixed-initiative approach to mitigate this pain point. On one hand, machines are adopted to perform precise and trivial operations, such as mapping numerical values to shape attributes and aligning shapes. On the other hand, we rely on humans to perform subjective and creative tasks, such as changing embellishments or approving the edits made by machines. We encapsulate our technique in a PowerPoint add-in prototype and demonstrate the effectiveness by applying our technique on a diverse set of infographic bar chart examples.