Examining Effort in 1D Uncertainty Communication Using Individual Differences in Working Memory and NASA-TLX
Spencer Castro, Helia Hosseinpour, P. Samuel Quinan, Lace Padilla
External link (DOI)
View presentation:2021-10-29T13:30:00ZGMT-0600Change your timezone on the schedule page
2021-10-29T13:30:00Z
Abstract
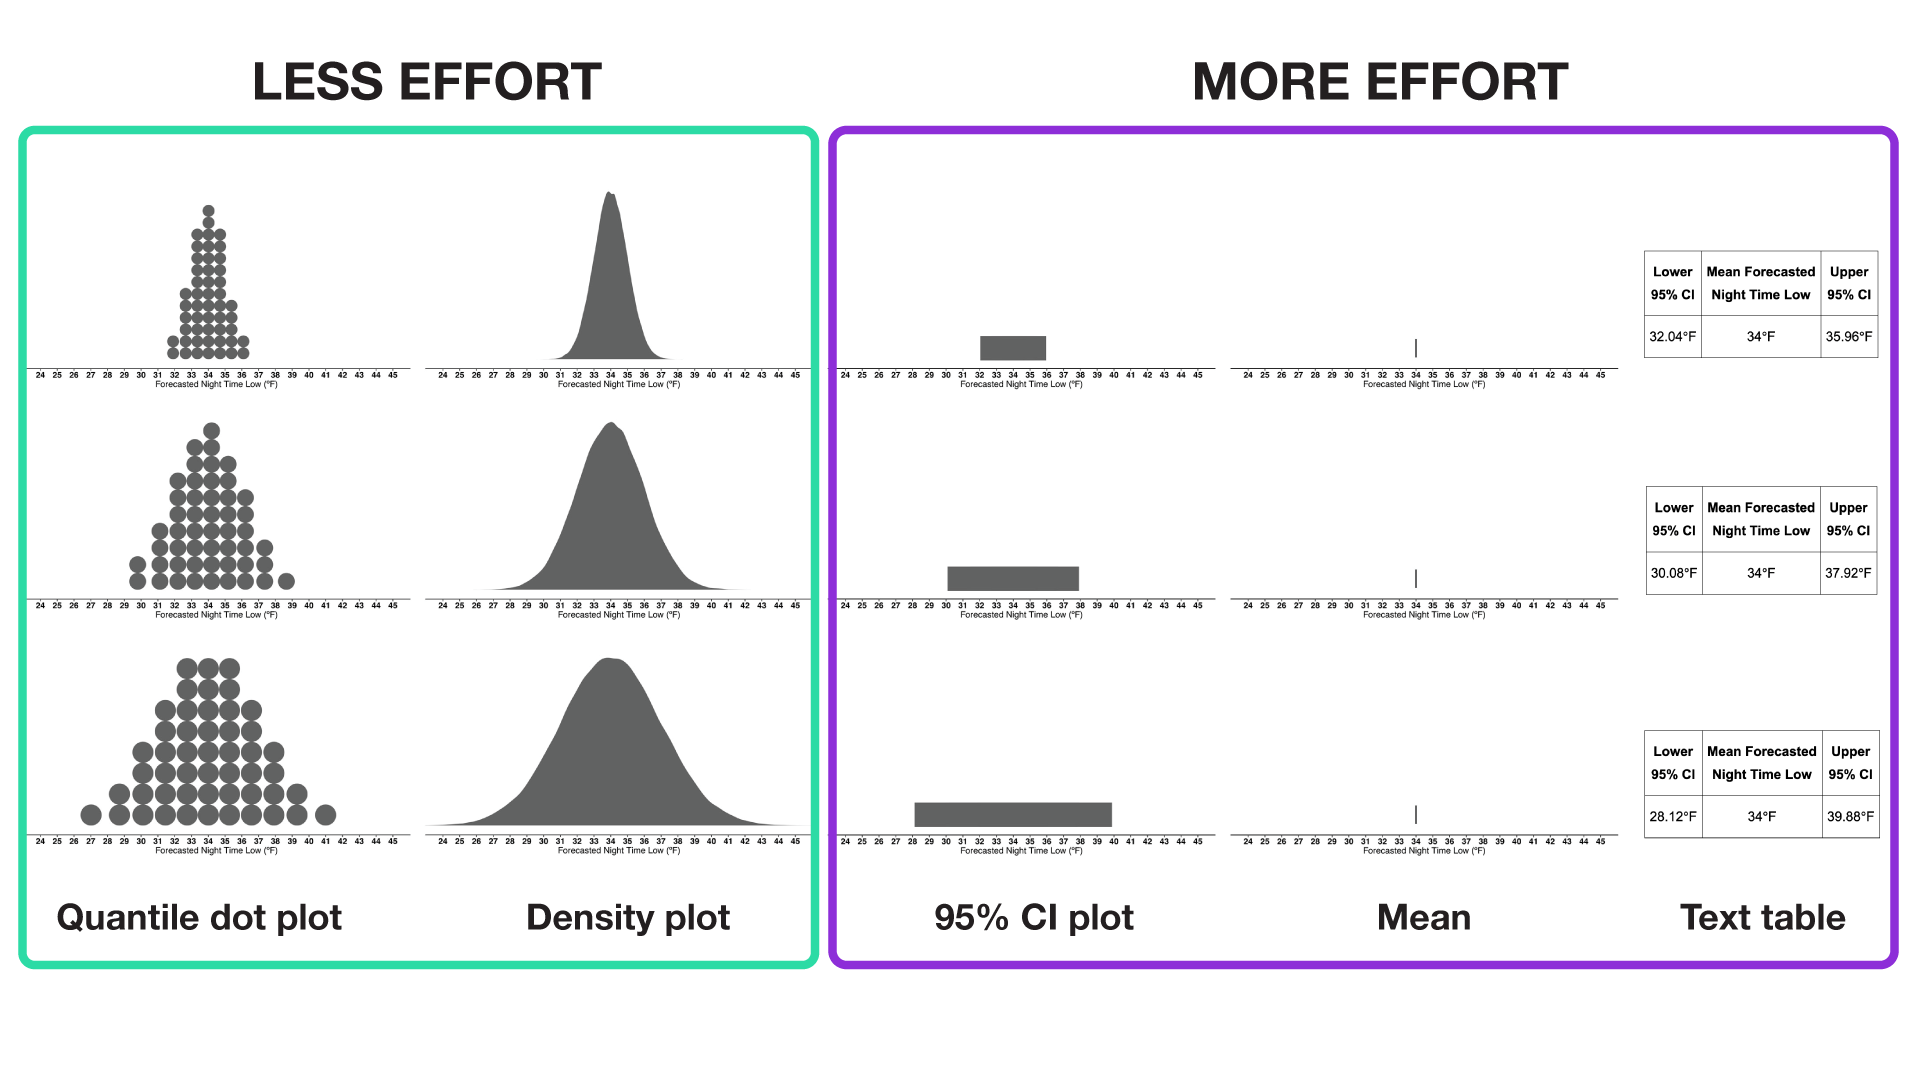
As uncertainty visualizations for general audiences become increasingly common, designers must understand the full impact of uncertainty communication techniques on viewers' decision processes. Prior work demonstrates mixed performance outcomes with respect to how individuals make decisions using various visual and textual depictions of uncertainty. Part of the inconsistency across findings may be due to an over-reliance on task accuracy, which cannot, on its own, provide a comprehensive understanding of how uncertainty visualization techniques support reasoning processes. In this work, we advance the debate surrounding the efficacy of modern 1D uncertainty visualizations by conducting converging quantitative and qualitative analyses of both the effort and strategies used by individuals when provided with quantile dotplots, density plots, interval plots, mean plots, and textual descriptions of uncertainty. We utilize two approaches for examining effort across uncertainty communication techniques: a measure of individual differences in working-memory capacity known as an operation span (OSPAN) task and self-reports of perceived workload via the NASA-TLX. The results reveal that both visualization methods and working-memory capacity impact participants' decisions. Specifically, quantile dotplots and density plots (i.e., distributional annotations) result in more accurate judgments than interval plots, textual descriptions of uncertainty, and mean plots (i.e., summary annotations). Additionally, participants' open-ended responses suggest that individuals viewing distributional annotations are more likely to employ a strategy that explicitly incorporates uncertainty into their judgments than those viewing summary annotations. When comparing quantile dotplots to density plots, this work finds that both methods are equally effective for low-working-memory individuals. However, for individuals with high-working-memory capacity, quantile dotplots evoke more accurate responses with less perceived effort. Given these results, we advocate for the inclusion of converging behavioral and subjective workload metrics in addition to accuracy performance to further disambiguate meaningful differences among visualization techniques.