A Visual Analytics System for Water Distribution System Optimization
Yiran Li, Erin Musabandesu, Takanori Fujiwara, Frank J. Loge, Kwan-Liu Ma
External link (DOI)
View presentation:2021-10-28T17:00:00ZGMT-0600Change your timezone on the schedule page
2021-10-28T17:00:00Z
Keywords
Feature Detection, Extraction, Tracking & Transformation, Other Application Areas, Application Motivated Visualization, Tabular Data
Abstract
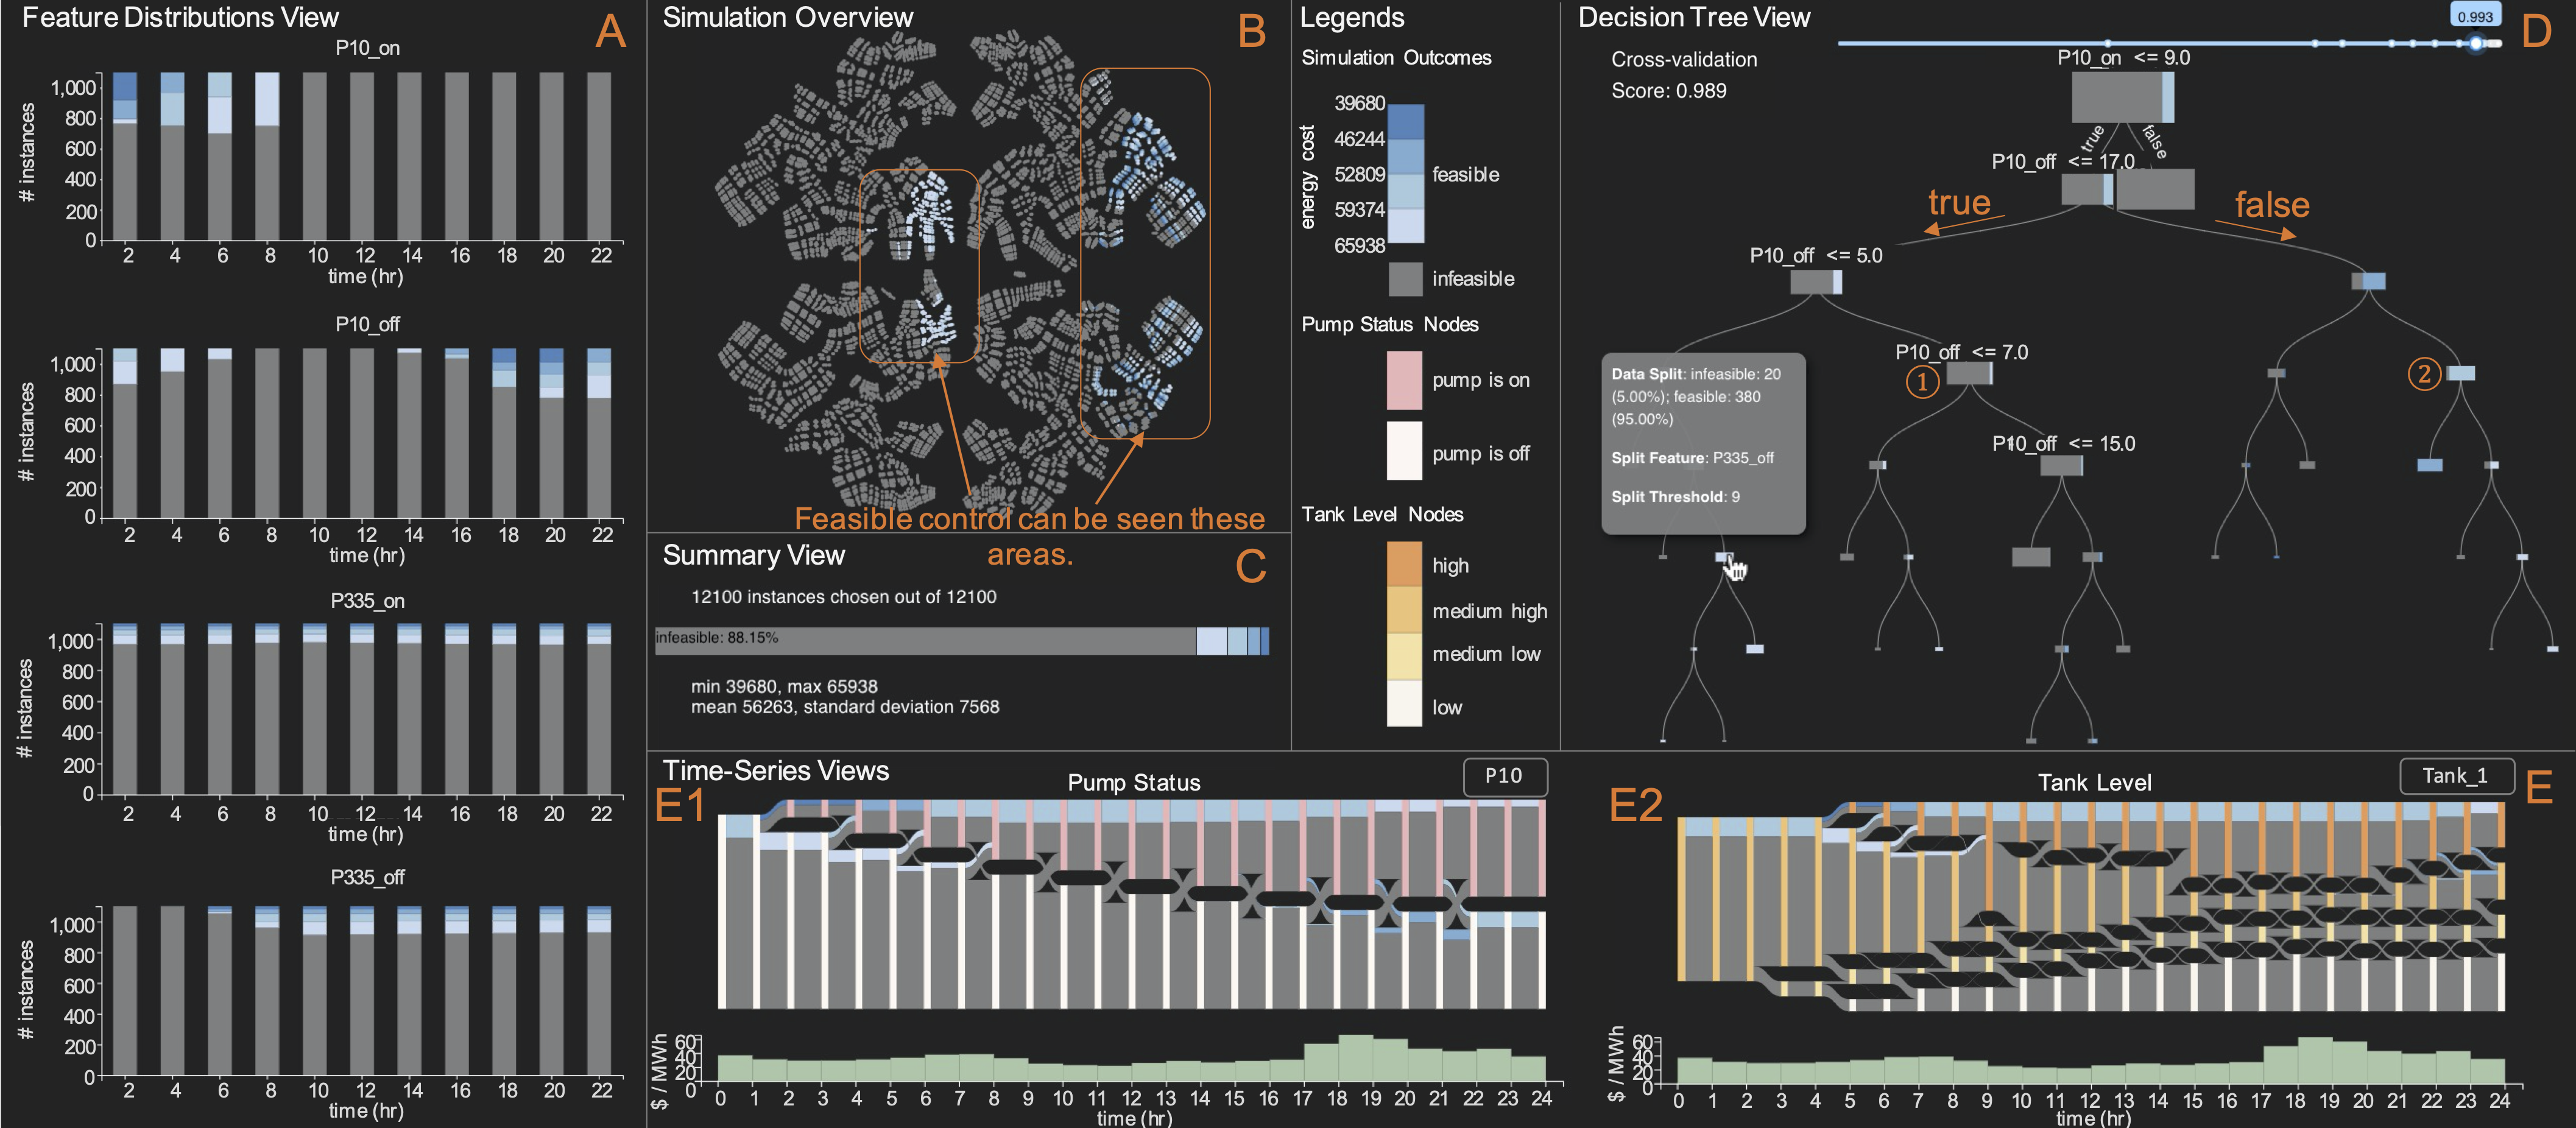
The optimization of water distribution systems (WDSs) is vital to minimize energy costs required for their operations. A principal approach taken by researchers is identifying an optimal scheme for water pump controls through examining computational simulations of WDSs. However, due to a large number of possible control combinations and the complexity of WDS simulations, it remains non-trivial to identify the best pump controls by reviewing the simulation results. To address this problem, we design a visual analytics system that helps understand relationships between simulation inputs and outputs towards better optimization. Our system incorporates interpretable machine learning as well as multiple linked visualizations to capture essential input-output relationships from complex WDS simulations. We demonstrate our system's effectiveness through a practical case study and evaluate its usability through expert reviews. Our results show that our system can lessen the burden of analysis and assist in determining optimal operating schemes.