Honorable Mention
Semantic Resizing of Charts Through Generalization: A Case Study with Line Charts
Vidya Setlur, Haeyong Chung
External link (DOI)
View presentation:2021-10-28T15:10:00ZGMT-0600Change your timezone on the schedule page
2021-10-28T15:10:00Z
Fast forward
Direct link to video on YouTube: https://youtu.be/yPKnVjYf8bM
Keywords
Multi-Resolution and Level of Detail Techniques, Software Prototype, Visual Representation Design
Abstract
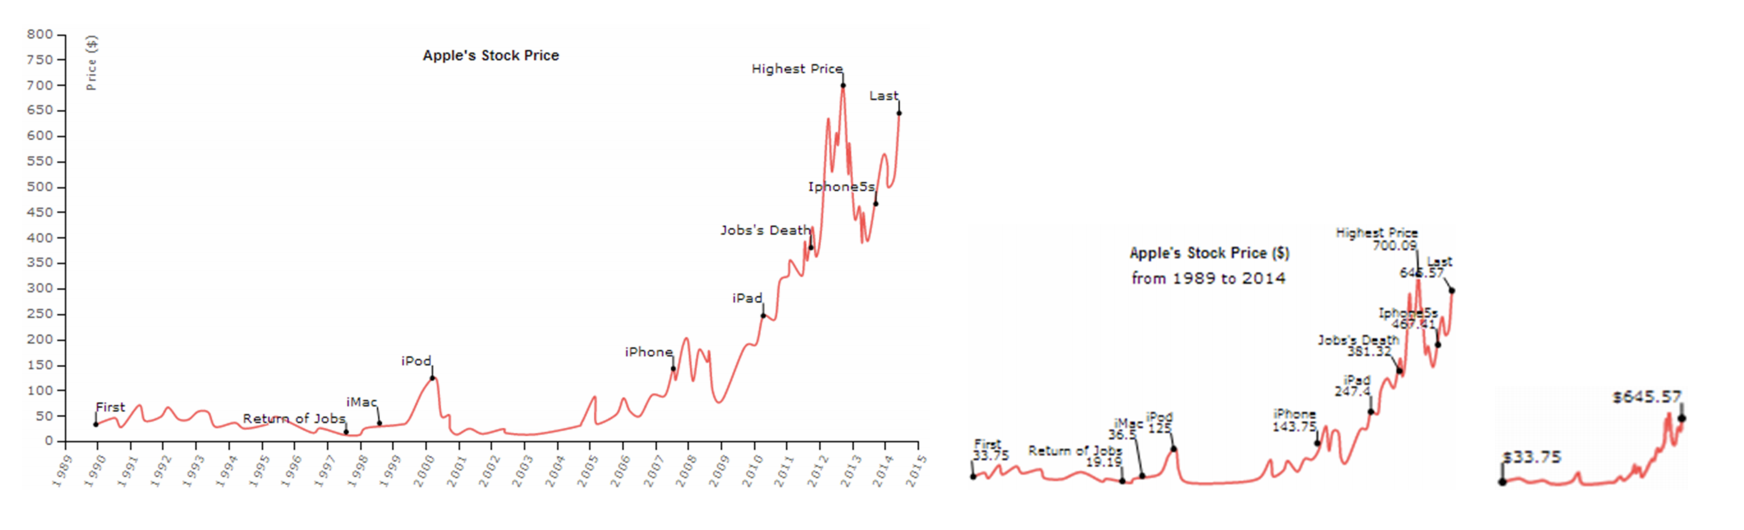
Inspired by cartographic generalization principles, we present a generalization technique for rendering line charts at different sizes, preserving the important semantics of the data at that display size.The algorithm automatically determines the generalization operators to be applied at that size based on spatial density, distance, and the semantic importance of the various visualization elements in the line chart. A qualitative evaluation of the prototype that implemented the algorithm indicates that the generalized line charts pre-served the general data shape, while minimizing visual clutter. We identify future opportunities where generalization can be extended and applied to other chart types and visual analysis authoring tools.