Bayesian Modelling of Alluvial Diagram Complexity
Anjana Arunkumar, Shashank Ginjpalli, Chris Bryan
External link (DOI)
View presentation:2021-10-28T15:20:00ZGMT-0600Change your timezone on the schedule page
2021-10-28T15:20:00Z
Fast forward
Direct link to video on YouTube: https://youtu.be/ugnuGYwf3gE
Keywords
Perception & Cognition, Datasets, Human-Subjects Quantitative Studies
Abstract
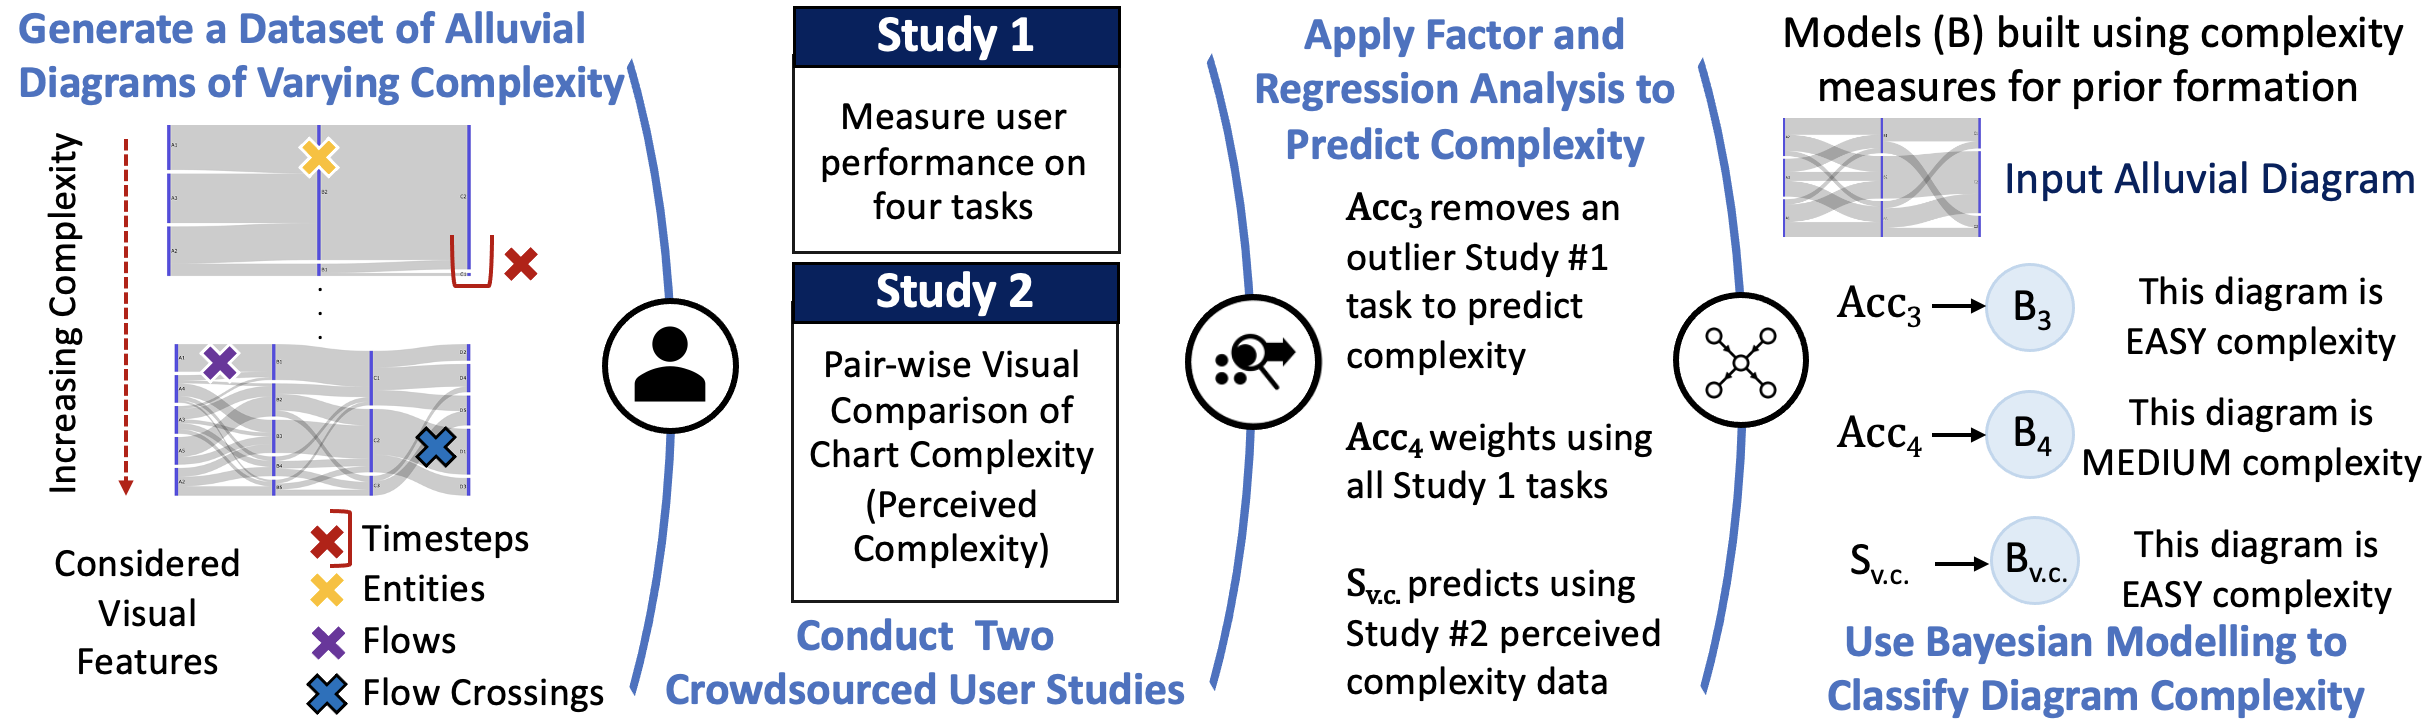
Alluvial diagrams are a popular technique for visualizing flow and relational data. However, successfully reading and interpreting the data shown in an alluvial diagram is likely influenced by factors such as data volume, complexity, and chart layout. To understand how alluvial diagram consumption is impacted by its visual features, we conduct two crowdsourced user studies with a set of alluvial diagrams of varying complexity, and examine (i) participant performance on analysis tasks, and (ii) the perceived complexity of the charts. Using the study results, we employ Bayesian modelling to predict participant classification of diagram complexity. We find that, while multiple visual features are important in contributing to alluvial diagram complexity, interestingly the most important feature changes depending on the type of complexity being modeled, i.e. task complexity vs. perceived complexity.