How Learners Sketch Data Stories
Rahul Bhargava, Dee Williams, Catherine D’Ignazio
External link (DOI)
View presentation:2021-10-27T14:00:00ZGMT-0600Change your timezone on the schedule page
2021-10-27T14:00:00Z
Fast forward
Direct link to video on YouTube: https://youtu.be/PxmXsBku_w8
Keywords
Communication/Presentation, Storytelling, General Public, Methodologies, Taxonomy, Models, Frameworks, Theory, Visual Representation Design
Abstract
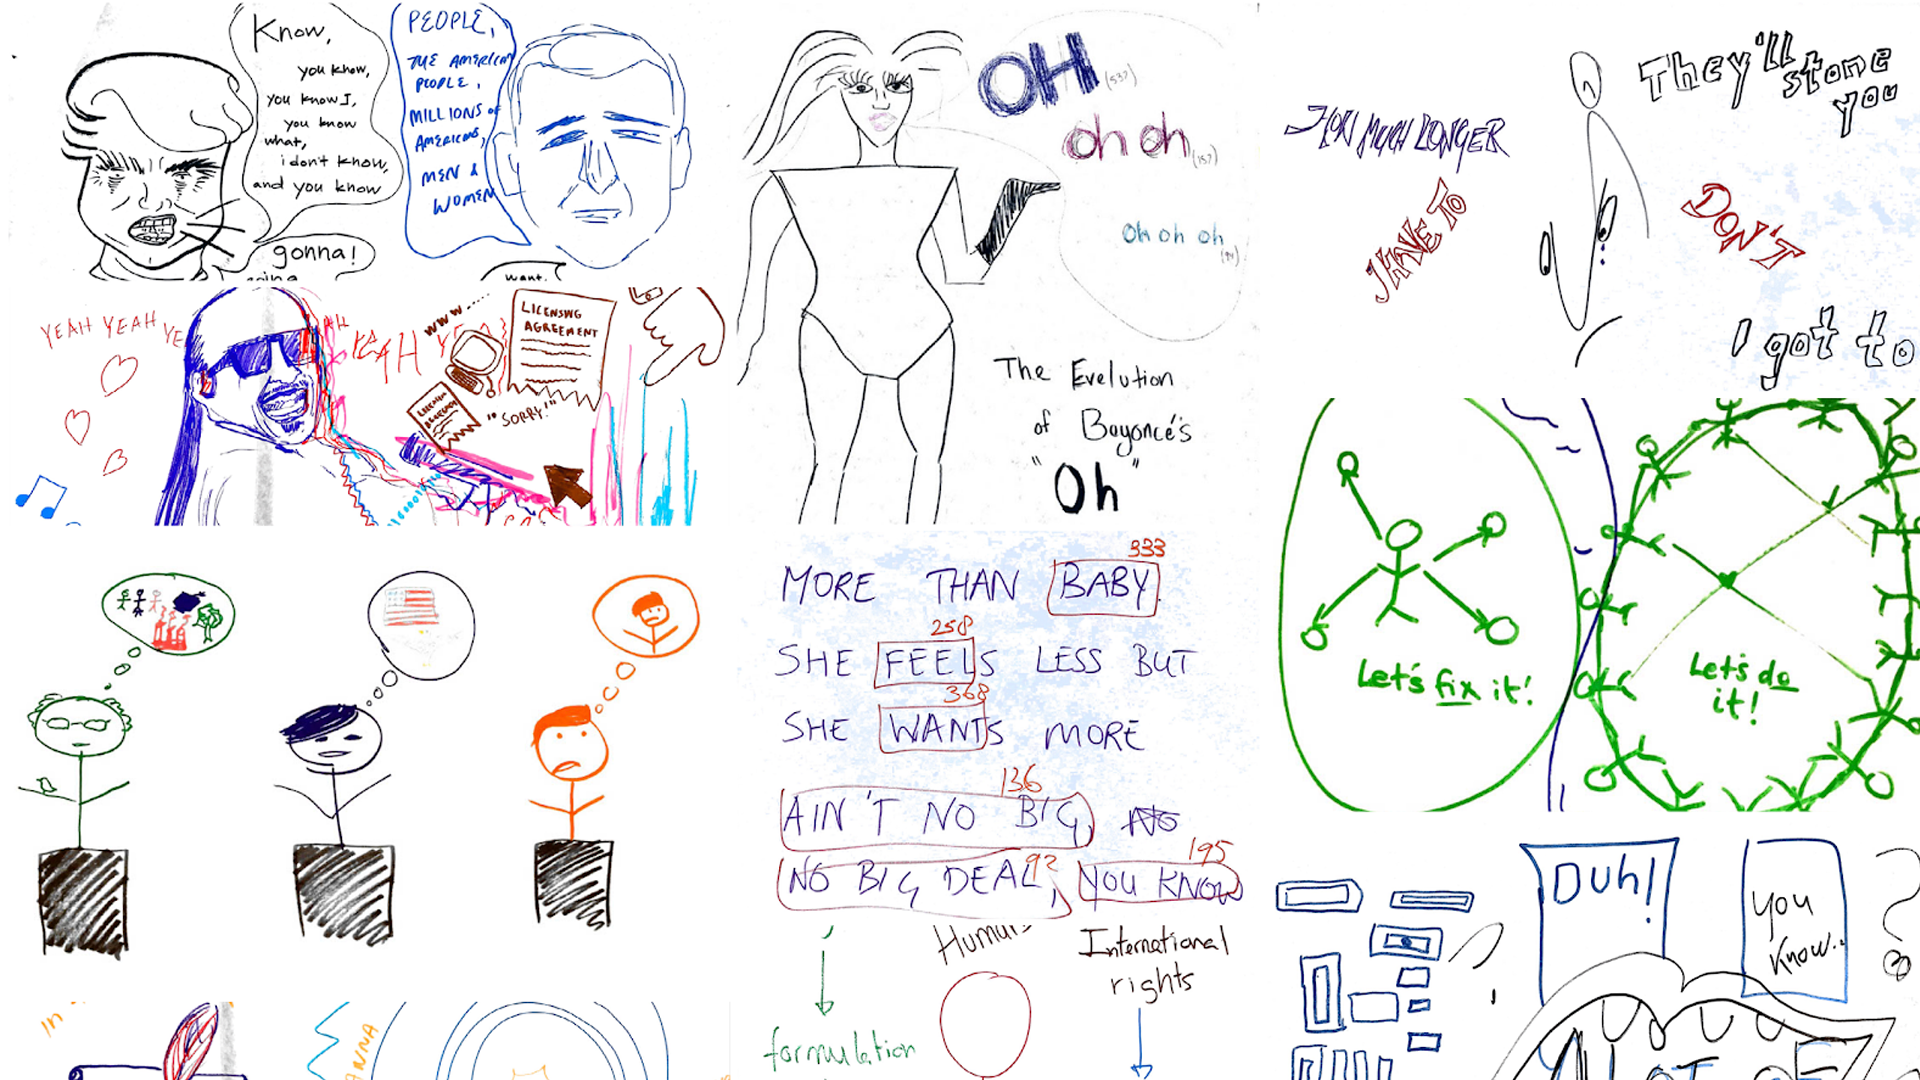
\abstract{Learning data storytelling involves a complex web of skills. Professional and academic educational offerings typically focus on the computational skills required, but professionals in the field employ many non-technical methods. Sketching by hand on paper is a common practice. This paper introduces and classifes a corpus of 101 data sketches produced by participants as part of a guided learning activity in informal and formal settings. We manually coded each sketch against 12 metrics related to visual encodings, representations, and story structure. We find evidence for preferential use of positional and shape-based encodings, a wide variety of mixed symbolic and textual representations, and a high prevalence of stories comparing subsets of data. These findings contribute to our understanding of how learners sketch with data. They can inform tool design for learners, and help create educational programs that introduce novices to sketching practices from the field.