Understanding the Effects of Visualizing Missing Values on Visual Data Exploration
Hayeong Song, Yu Fu, Bahador Saket, John Stasko
External link (DOI)
View presentation:2021-10-28T18:10:00ZGMT-0600Change your timezone on the schedule page
2021-10-28T18:10:00Z
Keywords
Uncertainty Visualization, Data Analysis, Reasoning, Problem Solving, and Decision Making, Guidelines, Human-Subjects Qualitative Studies, Human-Subjects Quantitative Studies, Data Type Agnostic
Abstract
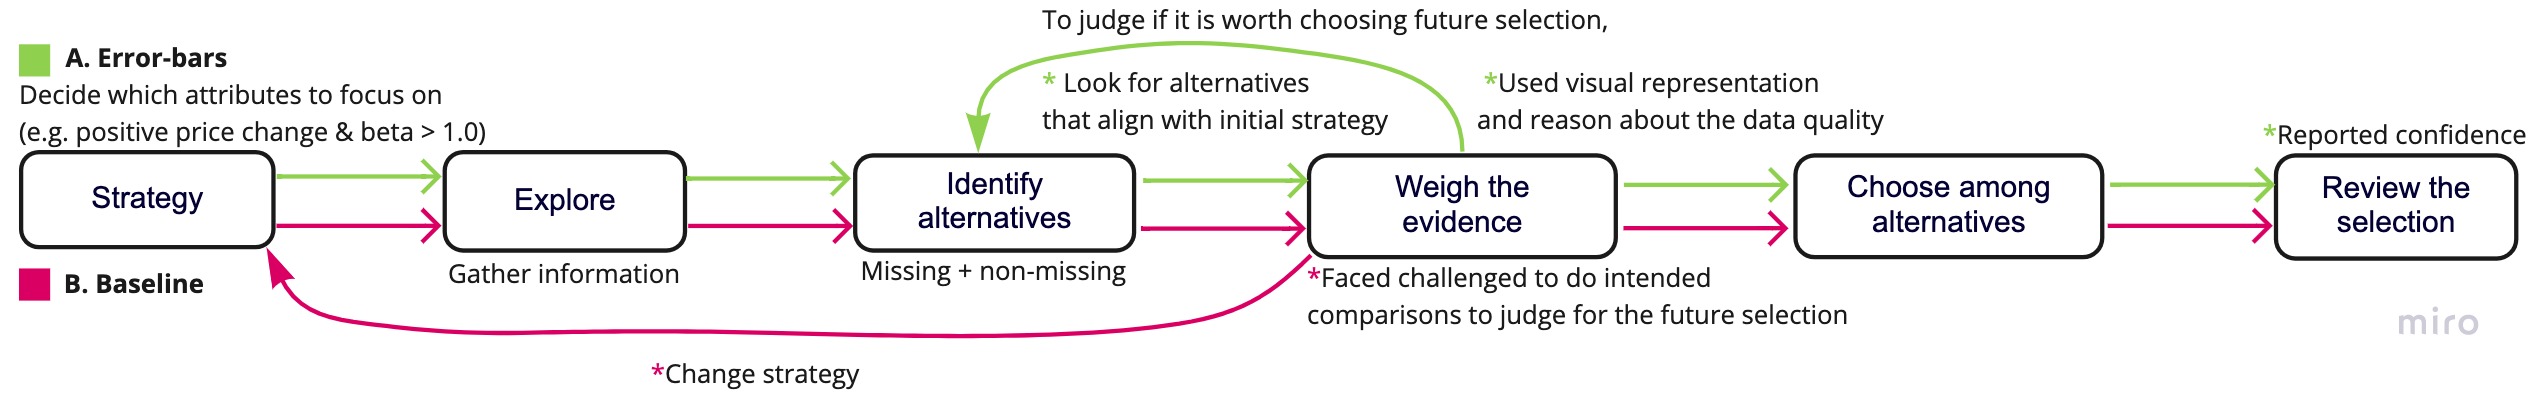
When performing data analysis, people often confront data sets containing missing values. We conducted an empirical study to understand the effect of visualizing those missing values on participants’ decision-making processes while performing a visual data exploration task. More specifically, our study participants purchased a hypothetical portfolio of stocks based on a data set where some stocks had missing values for attributes such as PE ratio, beta, and EPS. The experiment used scatterplots to communicate the stock data. For one group of participants, stocks with missing values simply were not shown, while the second group saw such stocks depicted with estimated values as points with error bars. We measured participants’ cognitive load involved in decision-making with data with missing values. Our results indicate that their decision-making workflow was different across two conditions.