Histogram binning revisited with a focus on human perception
Raphael Sahann, Torsten Möller, Johanna Schmidt
External link (DOI)
View presentation:2021-10-28T15:50:00ZGMT-0600Change your timezone on the schedule page
2021-10-28T15:50:00Z
Keywords
Perception & Cognition, Guidelines, Human-Subjects Quantitative Studies
Abstract
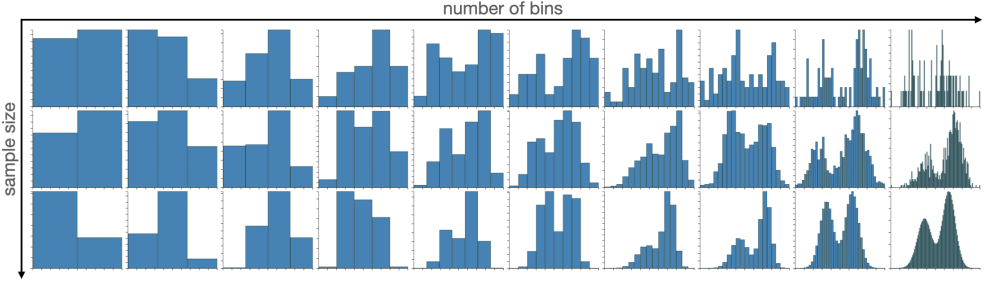
This paper presents a quantitative user study to evaluate how well users can visually perceive the underlying data distribution from a histogram representation. We used histograms with different sample and bin sizes and four different distributions (uniform, normal, bimodal, and gamma). The study results confirm that, in general, more bins correlate with fewer errors by the viewers. However, upon a certain number of bins, the error rate cannot be improved by adding more bins. By comparing our study results with the outcomes of existing mathematical models for histogram binning (e.g., Sturges’ formula, Scott’s normal reference rule, the Rice Rule, or Freedman–Diaconis’ choice), we can see that most of them overestimate the number of bins necessary to make the distribution visible to a human viewer.