Best Paper Award
Jurassic Mark: Inattentional Blindness for a Datasaurus Reveals that Visualizations are Explored, not Seen
Tal Boger, Steven Most, Steven Franconeri
External link (DOI)
View presentation:2021-10-26T16:00:00ZGMT-0600Change your timezone on the schedule page
2021-10-26T16:00:00Z
Fast forward
Direct link to video on YouTube: https://youtu.be/Lc17AABMkGM
Keywords
Charts, Diagrams, and Plots, Communication/Presentation, Storytelling, Perception & Cognition
Abstract
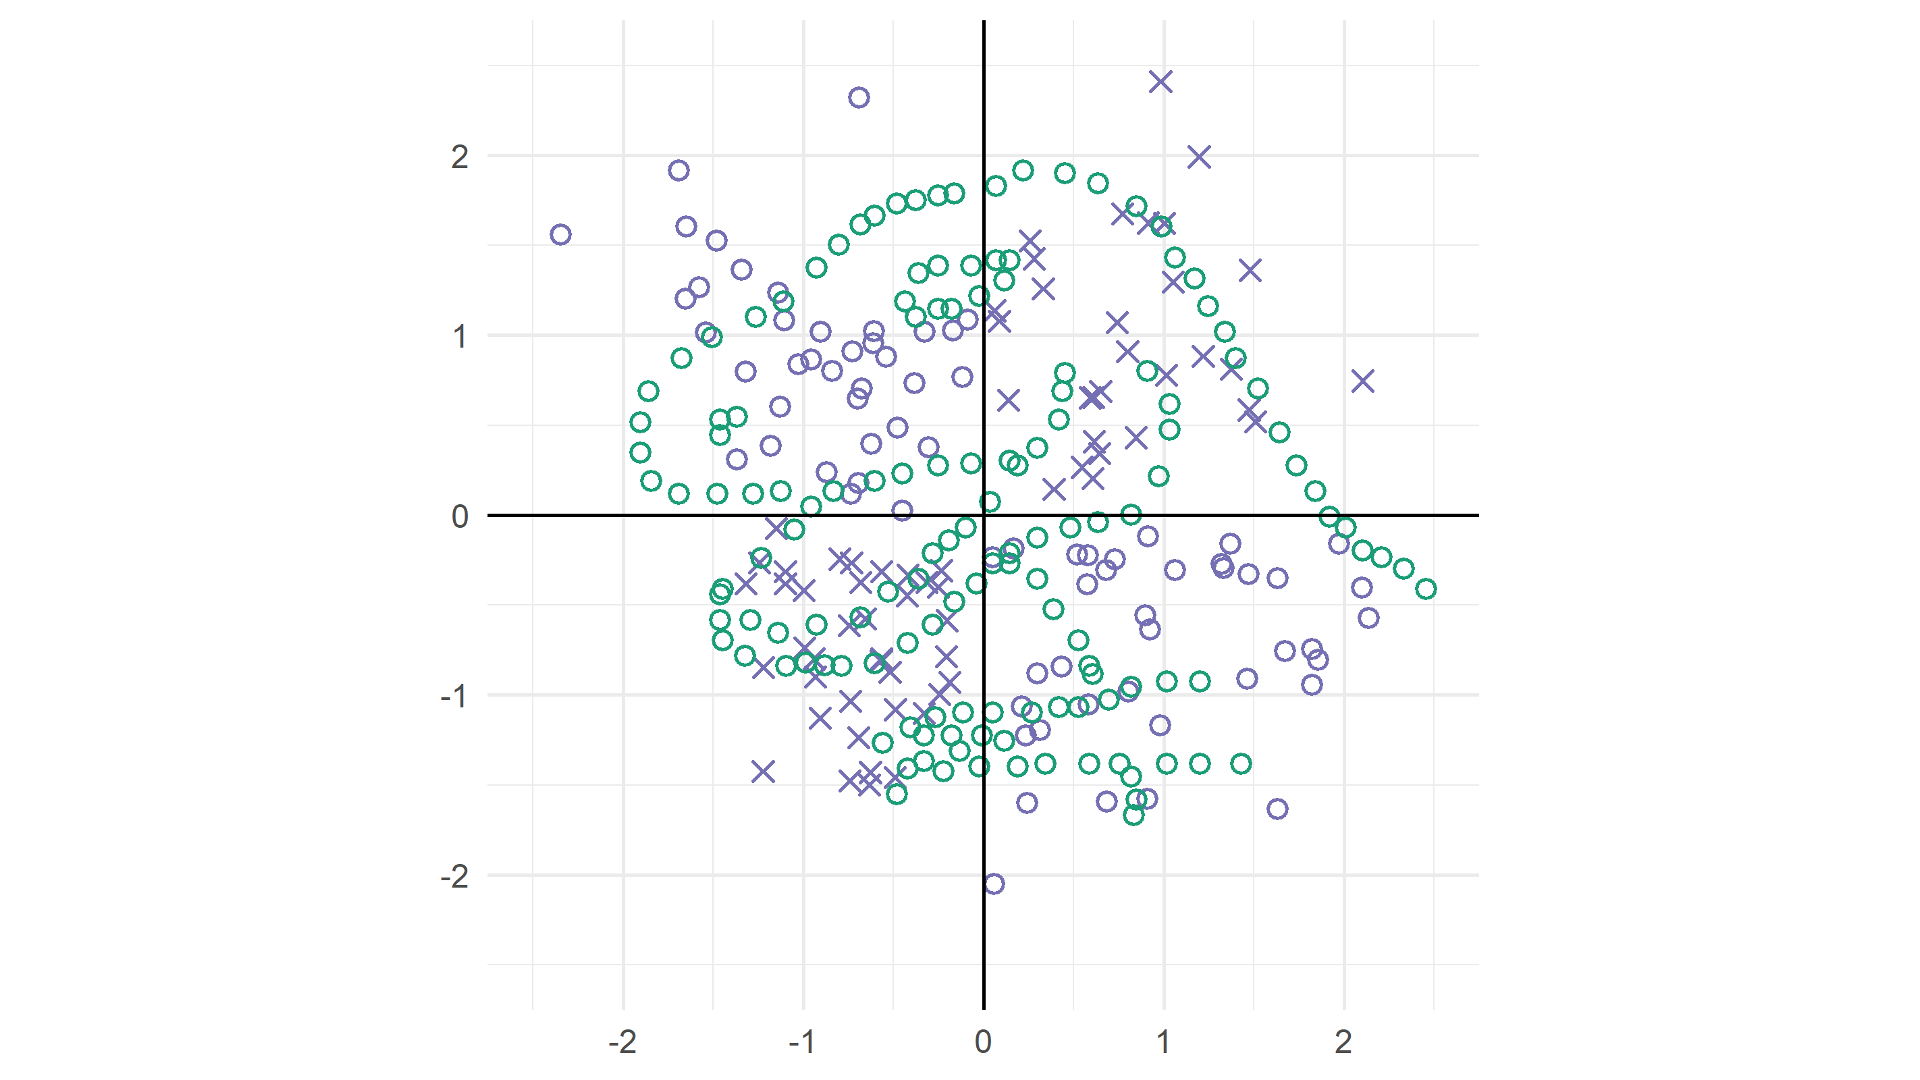
Graphs effectively communicate data because they capitalize on the visual system’s ability to rapidly extract patterns. Yet, this pattern extraction does not occur in a single glance. Instead, research on visual attention suggests that the visual system iteratively applies a sequence of filtering operations on an image, extracting patterns from subsets of visual information over time, and selectively inhibiting other information at each of these moments. To demonstrate that this powerful series of filtering operations also occurs during the perception of visualized data, we designed a task where participants made judgments from one class of marks on a scatterplot, presumably incentivizing them to relatively ignore other classes of marks. Participants consistently missed a conspicuous dinosaur in the ignored collection of marks (93% for a 1s presentation, and 61% for 2.5s), but not in a control condition where the judgment task was removed (25% for a 1s presentation, and 11% for 2.5s), suggesting that data visualizations are not "seen" in a single glance, and instead require an active process of exploration.