ChartSeer: Interactive Steering Exploratory Visual Analysis with Machine Intelligence
Jian Zhao, Mingming Fan, Mi Feng
External link (DOI)
View presentation:2021-10-28T15:00:00ZGMT-0600Change your timezone on the schedule page
2021-10-28T15:00:00Z
Fast forward
Direct link to video on YouTube: https://youtu.be/bjV0hNO9T2M
Keywords
Exploratory visual analysis, interactive steering, visualization recommendation, machine learning
Abstract
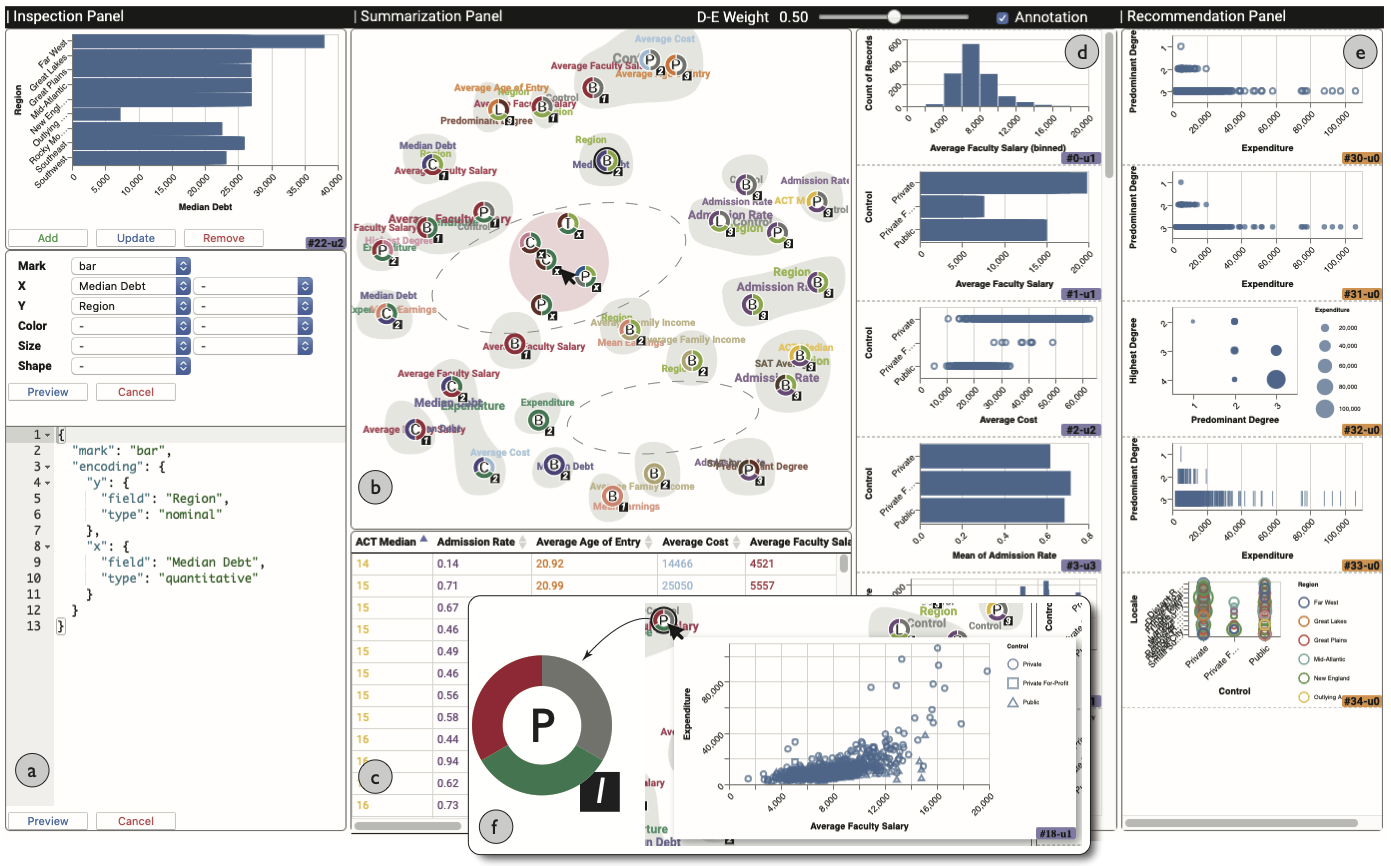
During exploratory visual analysis (EVA), analysts need to continually determine which subsequent activities to perform, such as which data variables to explore or how to present data variables visually. Due to the vast combinations of data variables and visual encodings that are possible, it is often challenging to make such decisions. Further, while performing local explorations, analysts often fail to attend to the holistic picture that is emerging from their analysis, leading them to improperly steer their EVA. These issues become even more impactful in the real world analysis scenarios where EVA occurs in multiple asynchronous sessions that could be completed by one or more analysts. To address these challenges, this work proposes ChartSeer, a system that uses machine intelligence to enable analysts to visually monitor the current state of an EVA and effectively identify future activities to perform. ChartSeer utilizes deep learning techniques to characterize analyst-created data charts to generate visual summaries and recommend appropriate charts for further exploration based on user interactions. A case study was first conducted to demonstrate the usage of ChartSeer in practice, followed by a controlled study to compare ChartSeer’s performance with a baseline during EVA tasks. The results demonstrated that ChartSeer enables analysts to adequately understand current EVA status and advance their analysis by creating charts with increased coverage and visual encoding diversity.