Showing Data about People: A Design Space of Anthropographics
Luiz Morais, Yvonne Jansen, Nazareno Andrade, Pierre Dragicevic
External link (DOI)
View presentation:2021-10-29T14:00:00ZGMT-0600Change your timezone on the schedule page
2021-10-29T14:00:00Z
Fast forward
Direct link to video on YouTube: https://youtu.be/jxS52dKN8F8
Keywords
Anthropographics, Design Space, Empathy, Compassion, Prosocial Behavior
Abstract
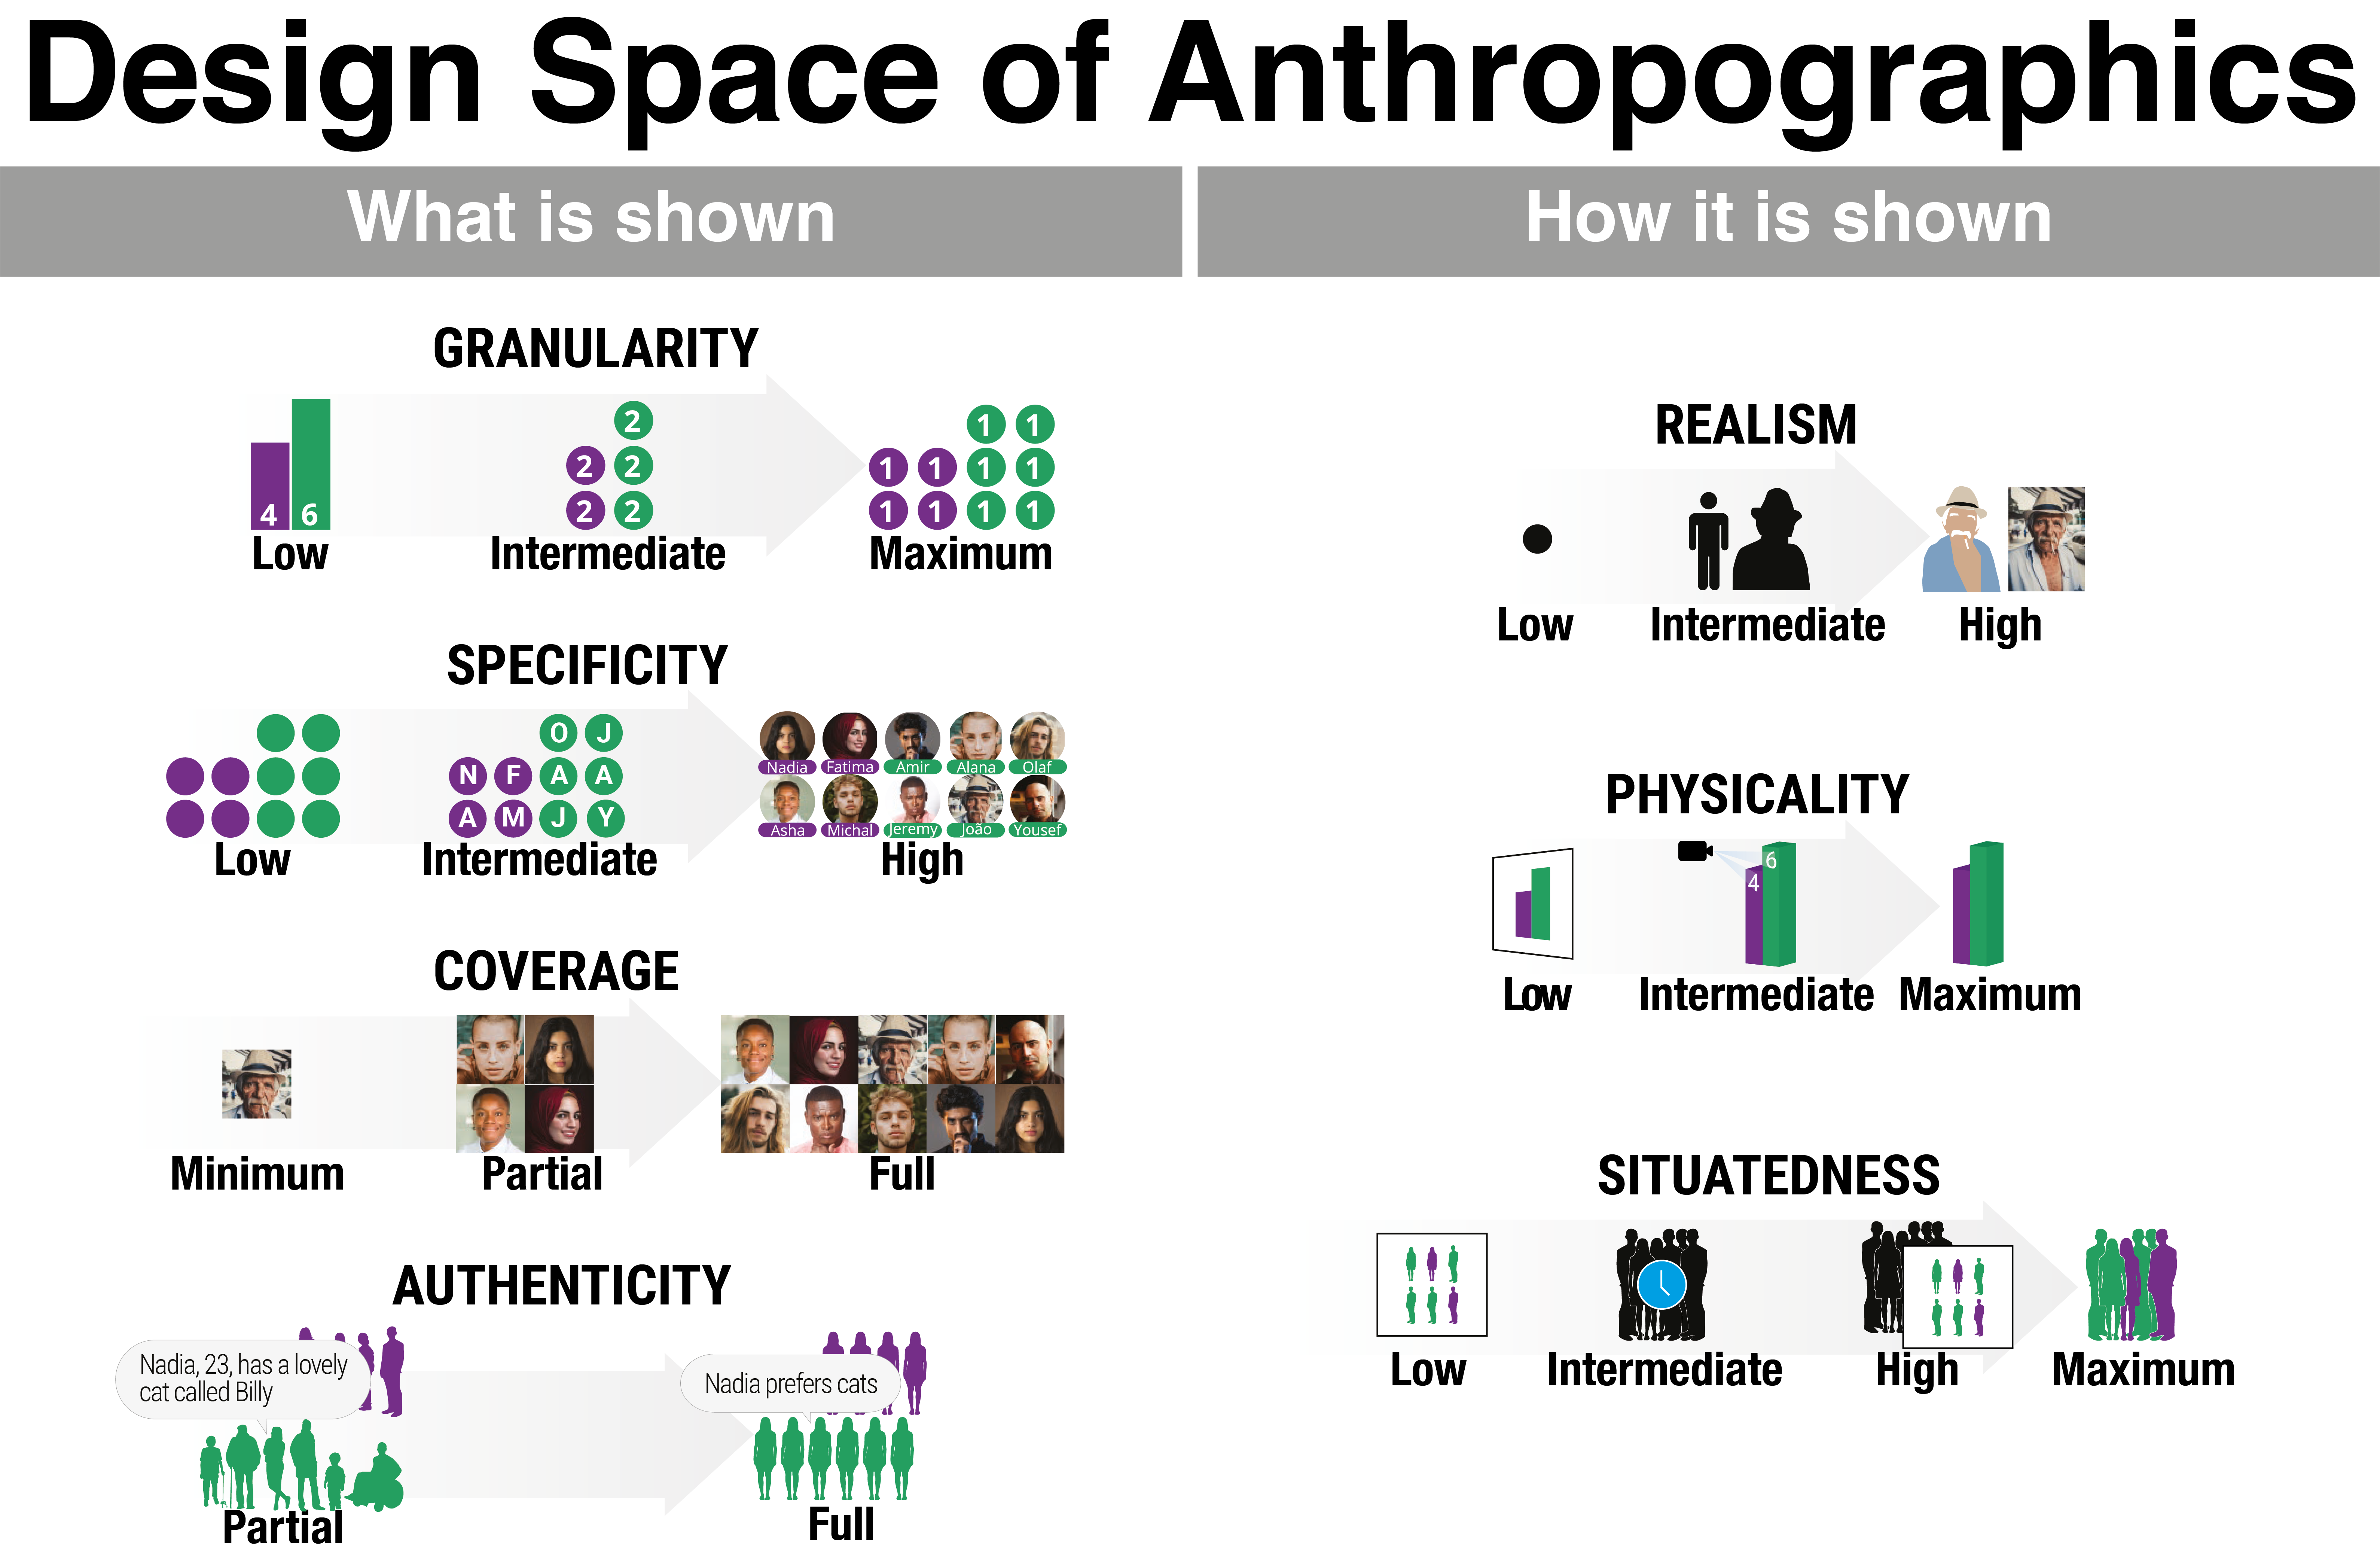
When showing data about people, visualization designers and data journalists often use design strategies that presumably help the audience relate to those people. The term anthropographics has been recently coined to refer to this practice and the resulting visualizations. Anthropographics is a rich and growing area, but the work so far has remained scattered. Despite preliminary empirical work and a few web essays written by practitioners, there is a lack of clear language for thinking about and communicating about anthropographics. We address this gap by introducing a conceptual framework and a design space for anthropographics. Our design space consists of seven elementary design dimensions that can be reasonably hypothesized to have some effect on prosocial feelings or behavior. It extends a previous design space and is informed by an analysis of 105 visualizations collected from newspapers, websites, and research papers. We use our conceptual framework and design space to discuss trade-offs, common design strategies, as well as future opportunities for design and research in the area of anthropographics.