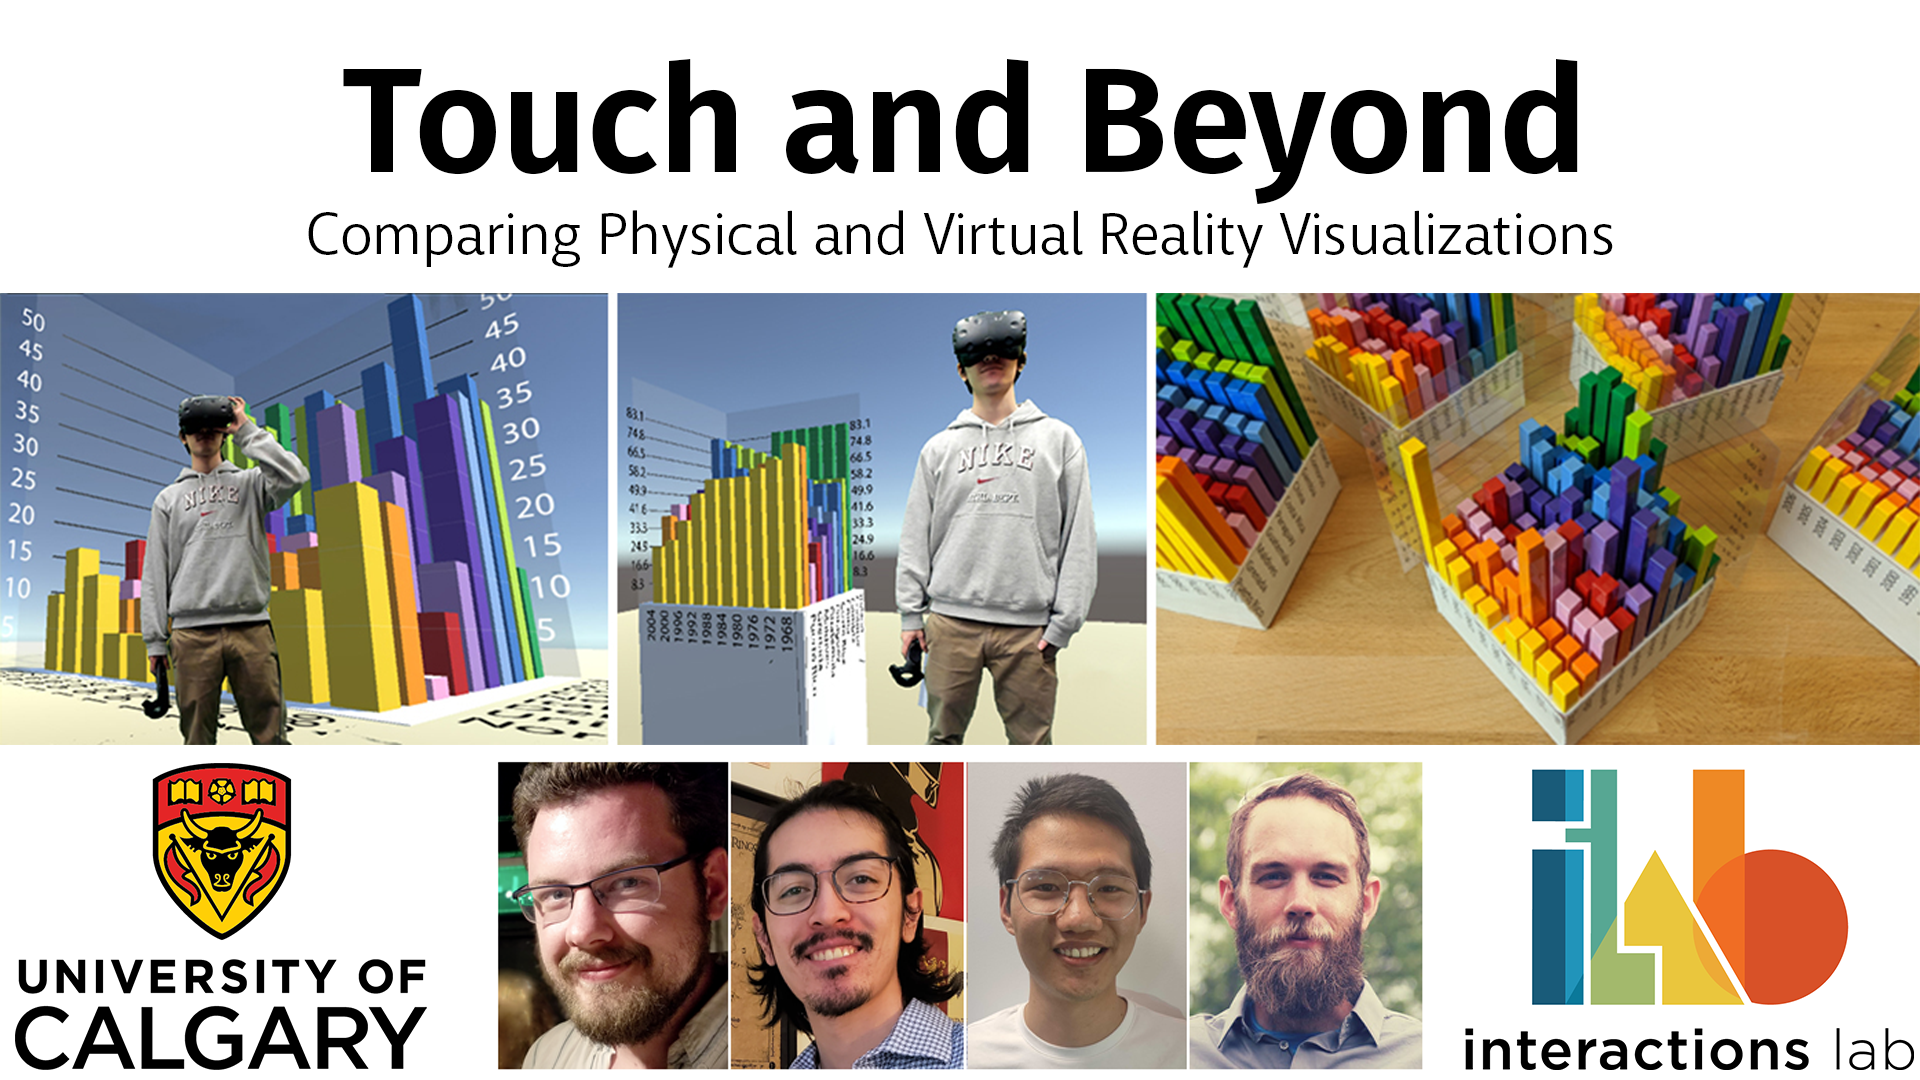
Touch and Beyond: Comparing Physical and Virtual Reality Visualizations
Kurtis Danyluk, Teoman Ulusoy, Wei Wei, Wesley Willett
External link (DOI)
View presentation:2021-10-27T18:00:00ZGMT-0600Change your timezone on the schedule page
2021-10-27T18:00:00Z
Fast forward
Direct link to video on YouTube: https://youtu.be/m5F9SbQ7cgc
Keywords
Data Visualization, Tools, Three Dimensional Displays, Virtual Reality, Bars, Task Analysis, Visualization, Human Computer Interaction, Visualization, Data Visualization, Virtual Reality, Physicalization
Abstract
We compare physical and virtual reality (VR) versions of simple data visualizations. We also explore how the addition of virtual annotation and filtering tools affects how viewers solve basic data analysis tasks. We report on two studies, inspired by previous examinations of data physicalizations. The first study examined differences in how viewers interact with physical hand-scale, virtual hand-scale, and virtual table-scale visualizations and the impact that the different forms had on viewer's problem solving behavior. A second study examined how interactive annotation and filtering tools might sup-port new modes of use that transcend the limitations of physical representations. Our results highlight challenges associated with virtual reality representations and hint at the potential of interactive annotation and filtering tools in VR visualizations.