Words of Estimative Correlation: Studying Verbalizations of Scatterplots
Rafael Henkin, Cagatay Turkay
External link (DOI)
View presentation:2021-10-28T14:15:00ZGMT-0600Change your timezone on the schedule page
2021-10-28T14:15:00Z
Fast forward
Direct link to video on YouTube: https://youtu.be/2Tx7vYsJbXw
Keywords
Information visualization, natural language generation, natural language processing, human-computer interaction
Abstract
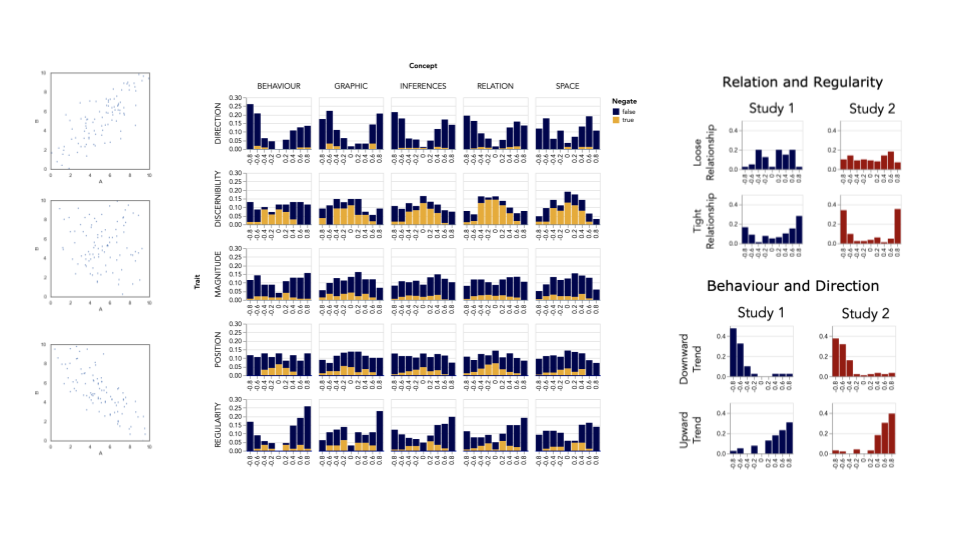
Natural language and visualization are being increasingly deployed together for supporting data analysis in different ways, from multimodal interaction to enriched data summaries and insights. Yet, researchers still lack systematic knowledge on how viewers verbalize their interpretations of visualizations, and how they interpret verbalizations of visualizations in such contexts. We describe two studies aimed at identifying characteristics of data and charts that are relevant in such tasks. The first study asks participants to verbalize what they see in scatterplots that depict various levels of orrelations. The second study then asks participants to choose visualizations that match a given verbal description of correlation. We extract key concepts from responses, organize them in a taxonomy and analyze the categorized responses. We observe that participants use a wide range of vocabulary across all scatterplots, but particular concepts are preferred for higher levels of correlation. A comparison between the studies reveals the ambiguity of some of the concepts. We discuss how the results could inform the design of multimodal representations aligned with the data and analytical tasks, and present a research roadmap to deepen the understanding about visualizations and natural language.