Multi-level Area Balancing of Clustered Graphs
Hsiang-Yun Wu, Martin Nöllenburg, Ivan Viola
External link (DOI)
View presentation:2021-10-28T17:00:00ZGMT-0600Change your timezone on the schedule page
2021-10-28T17:00:00Z
Fast forward
Direct link to video on YouTube: https://youtu.be/QL8QOQUN0b4
Keywords
Graph drawing, Voronoi tessellation, multi-level, spatially-efficient layout
Abstract
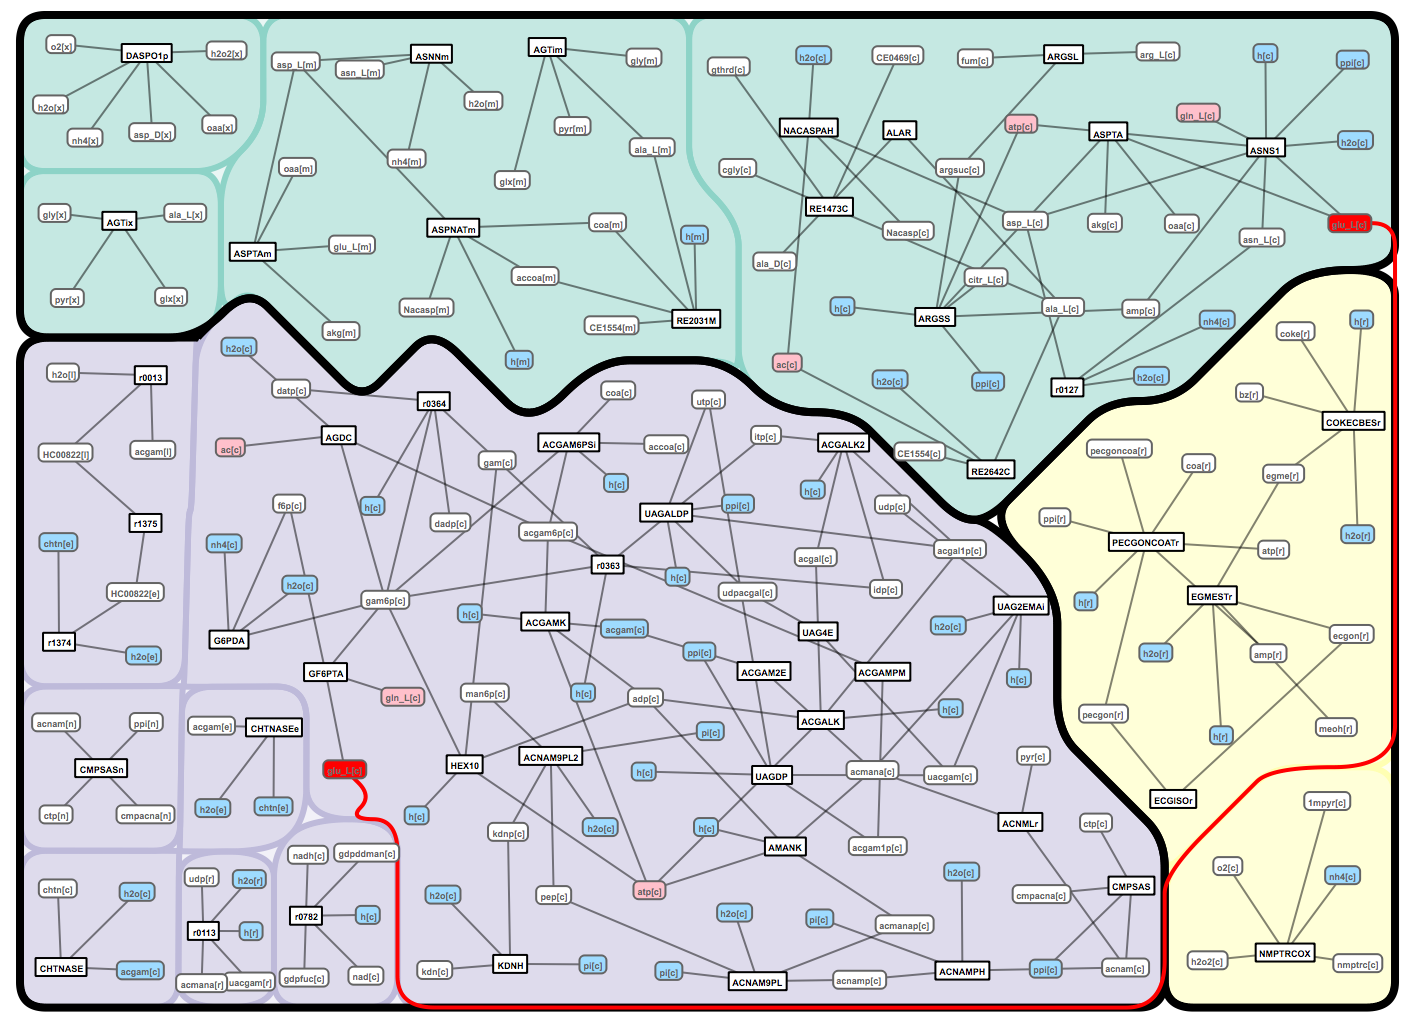
We present a multi-level area balancing technique for laying out clustered graphs to facilitate a comprehensive understanding of the complex relationships that exist in various fields, such as life sciences and sociology. Clustered graphs are often used to model relationships that are accompanied by attribute-based grouping information. Such information is essential for robust data analysis, such as for the study of biological taxonomies or educational backgrounds. Hence, the ability to smartly arrange textual labels and packing graphs within a certain screen space is therefore desired to successfully convey the attribute data . Here we propose to hierarchically partition the input screen space using Voronoi tessellations in multiple levels of detail. In our method, the position of textual labels is guided by the blending of constrained forces and the forces derived from centroidal Voronoi cells. The proposed algorithm considers three main factors: (1) area balancing, (2) schematized space partitioning, and (3) hairball management. We primarily focus on area balancing, which aims to allocate a uniform area for each textual label in the diagram. We achieve this by first untangling a general graph to a clustered graph through textual label duplication, and then coupling with spanning-tree-like visual integration. We illustrate the feasibility of our approach with examples and then evaluate our method by comparing it with well-known conventional approaches and collecting feedback from domain experts.