Can Visualization Alleviate Dichotomous Thinking? Effects of Visual Representations on the Cliff Effect
Jouni Helske, Satu Helske, Matthew Cooper, Anders Ynnerman, Lonni Besançon
External link (DOI)
View presentation:2021-10-29T13:45:00ZGMT-0600Change your timezone on the schedule page
2021-10-29T13:45:00Z
Fast forward
Direct link to video on YouTube: https://youtu.be/OS6D8IOLE1Q
Keywords
Statistical inference, visualization, cliff effect, confidence intervals, hypothesis testing, Bayesian inference
Abstract
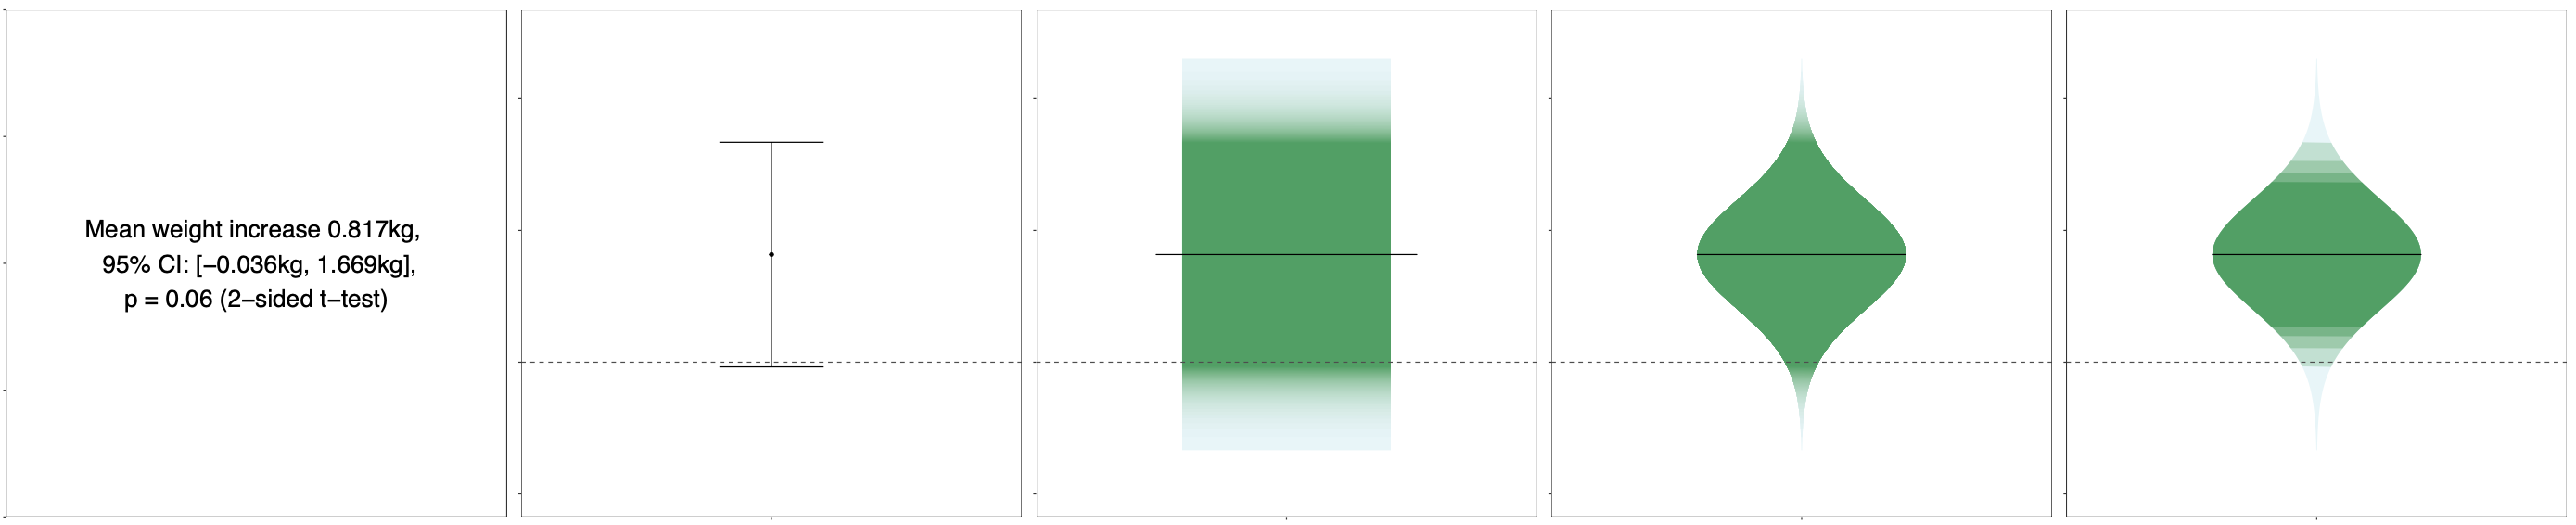
Common reporting styles for statistical results in scientific articles, such as p-values and confidence intervals (CI), have been reported to be prone to dichotomous interpretations, especially with respect to the null hypothesis significance testing framework. For example when the p-value is small enough or the CIs of the mean effects of a studied drug and a placebo are not overlapping, scientists tend to claim significant differences while often disregarding the magnitudes and absolute differences in the effect sizes. This type of reasoning has been shown to be potentially harmful to science. Techniques relying on the visual estimation of the strength of evidence have been recommended to reduce such dichotomous interpretations but their effectiveness has also been challenged. We ran two experiments on researchers with expertise in statistical analysis to compare several alternative representations of confidence intervals and used Bayesian multilevel models to estimate the effects of the representation styles on differences in researchers' subjective confidence in the results. We also asked the respondents' opinions and preferences in representation styles. Our results suggest that adding visual information to classic CI representation can decrease the tendency towards dichotomous interpretations - measured as the `cliff effect': the sudden drop in confidence around p-value 0.05 - compared with classic CI visualization and textual representation of the CI with p-values. All data and analyses are publicly available at https://github.com/helske/statvis.