Implicit Error, Uncertainty and Confidence in Visualization: an Archaeological Case Study
Georgia Panagiotidou, Ralf Vandam, Jeroen Poblome, Andrew Vande Moere
External link (DOI)
View presentation:2021-10-29T13:15:00ZGMT-0600Change your timezone on the schedule page
2021-10-29T13:15:00Z
Fast forward
Direct link to video on YouTube: https://youtu.be/XWf2SunPFVg
Keywords
data uncertainty, data visualization, implicit error, qualitative study, digital humanities, design study, archaeology
Abstract
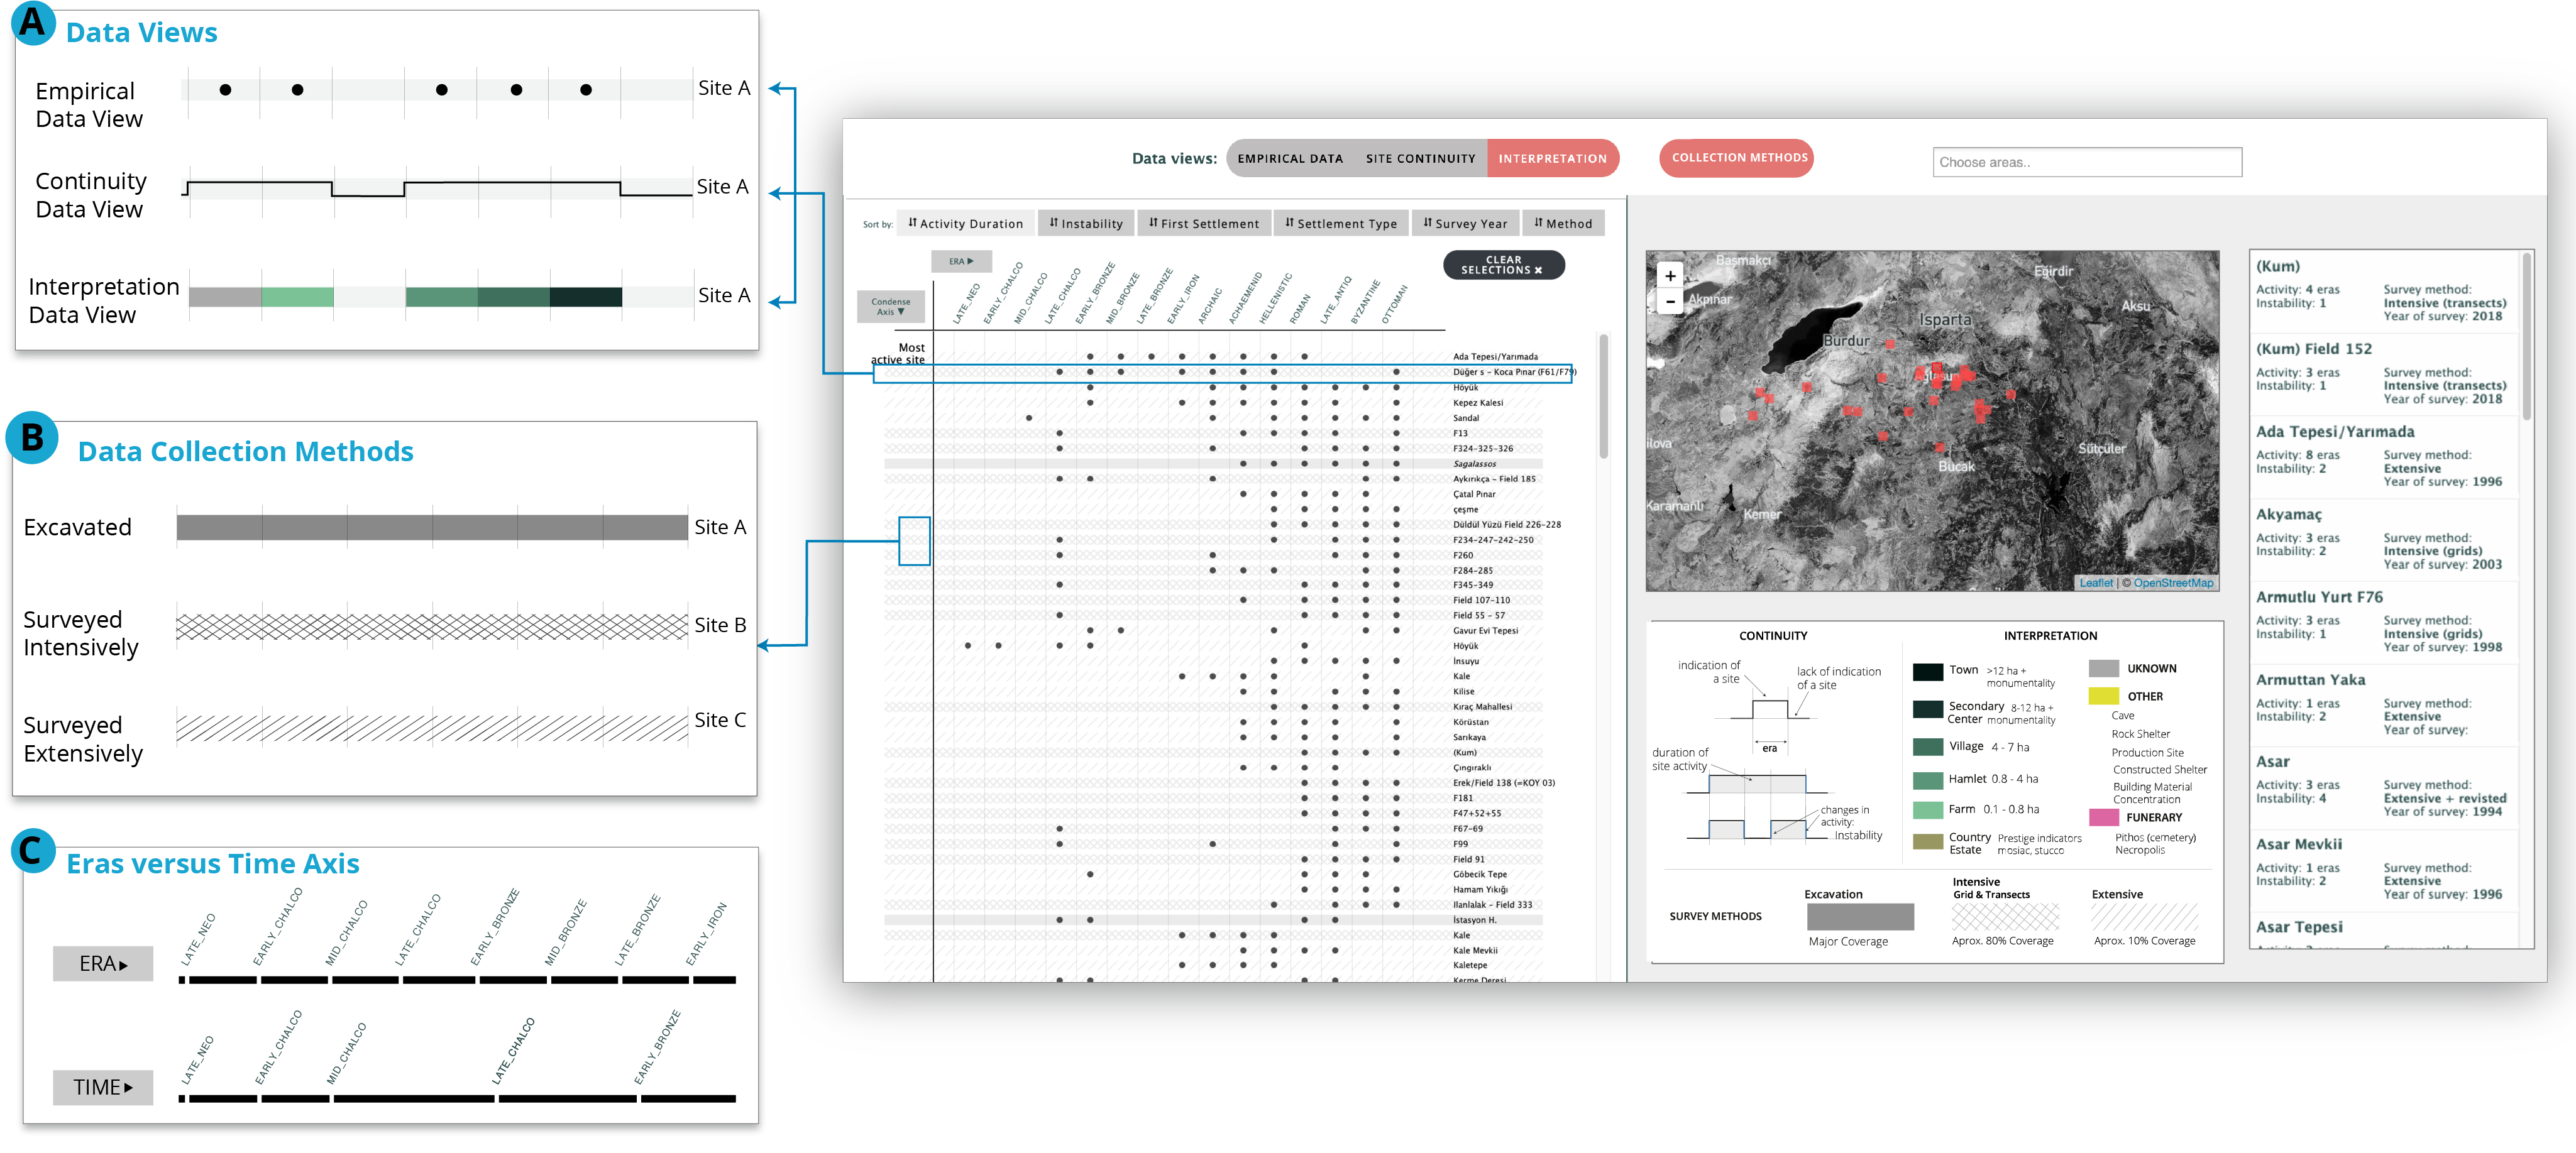
While we know that the visualization of quantifiable uncertainty impacts the confidence in insights, little is known about whether the same is true for uncertainty that originates from aspects so inherent to the data that they can only be accounted for qualitatively. Being embedded within an archaeological project, we realized how assessing such qualitative uncertainty is crucial in gaining a holistic and accurate understanding of regional spatio-temporal patterns of human settlements over millennia. We therefore investigated the impact of visualizing qualitative implicit errors on the sense-making process via a probe that deliberately represented three distinct implicit errors, i.e. differing collection methods, subjectivity of data interpretations and assumptions on temporal continuity. By analyzing the interactions of 14 archaeologists with different levels of domain expertise, we discovered that novices became more actively aware of typically overlooked data issues and domain experts became more confident of the visualization itself. We observed how participants quoted social factors to alleviate some uncertainty, while in order to minimize it they requested additional contextual breadth or depth of the data. While our visualization did not alleviate all uncertainty, we recognized how it sparked reflective meta-insights regarding methodological directions of the data. We believe our findings inform future visualizations on how to handle the complexity of implicit errors for a range of user typologies and for highly data-critical application domains such as the digital humanities.