Comparing Time-to-Solution for In Situ Visualization Paradigms at Scale
James Kress, Matthew Larsen, Jong Choi, Mark Kim, Mathew Wolf, Norbert Podhorszki, Scott Klasky, Hank Childs, David Pugmire
External link (DOI)
View presentation:2020-10-25T17:00:00ZGMT-0600Change your timezone on the schedule page
2020-10-25T17:00:00Z
Keywords
Abstract
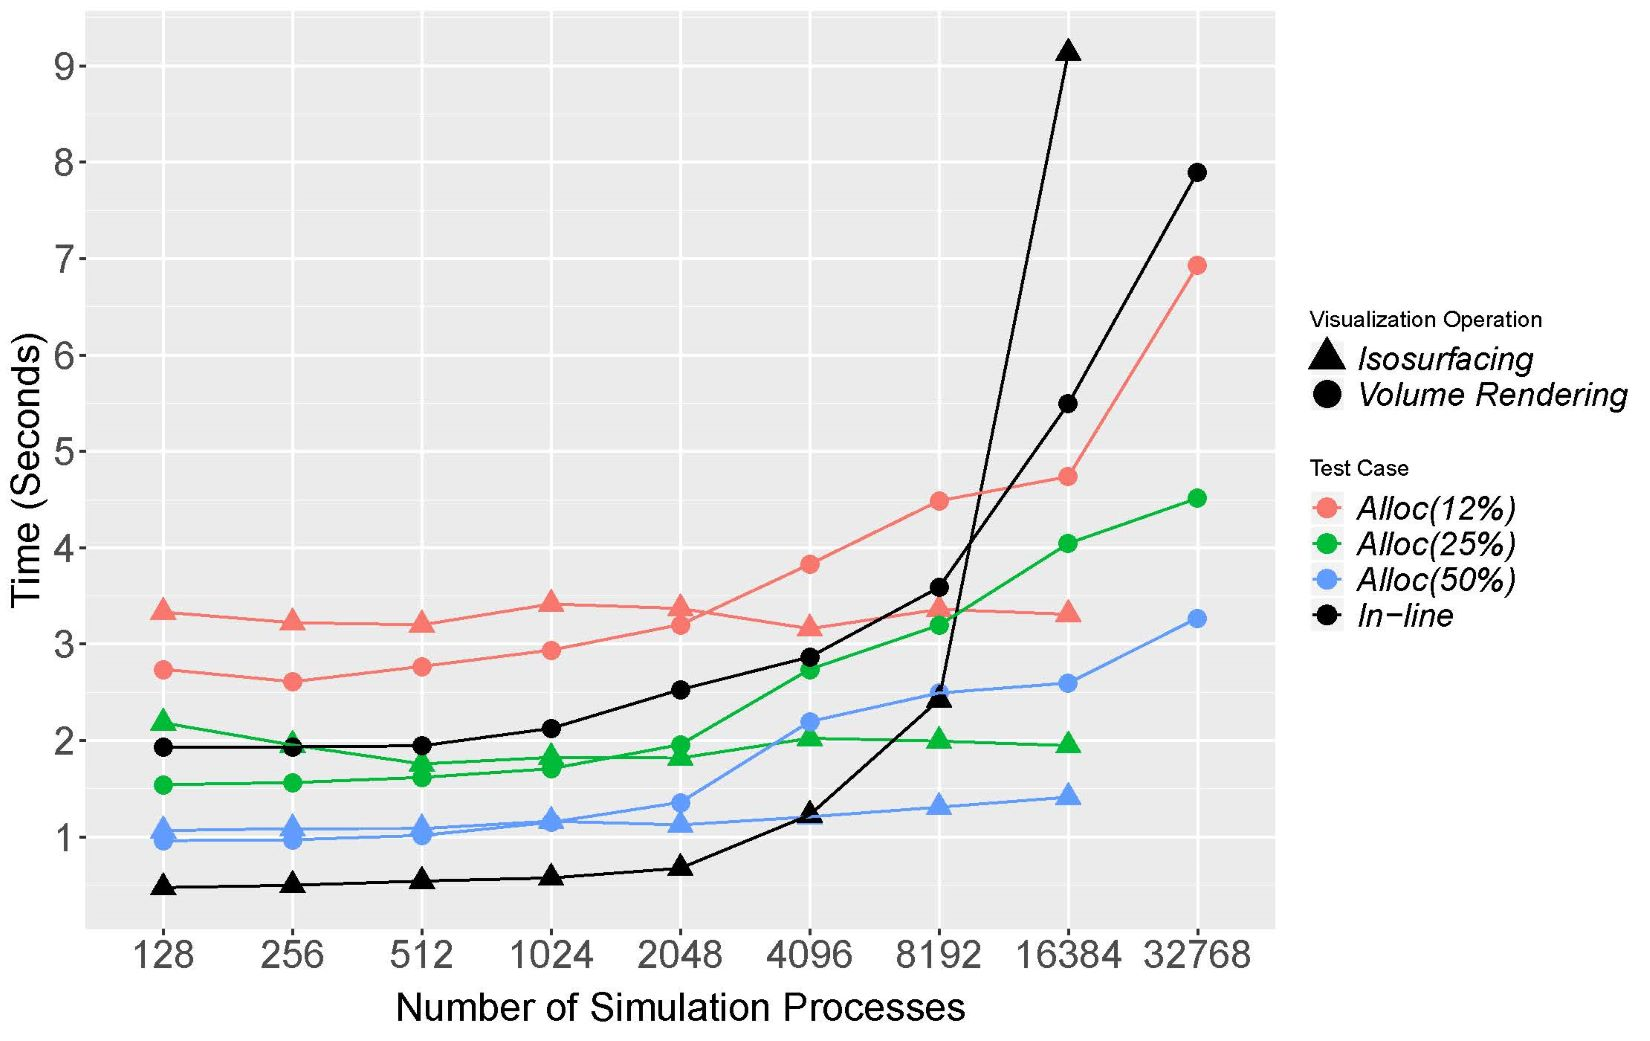
This short paper compares the time-to-solution for in-line and in-transit in situ visualization, analyzing when one paradigm is faster than another. To perform this comparison, we create a corpus of data by running a scaling study using two common visualization algorithms (isosurfacing and volume rendering), with in-line and in- transit. Our experiments vary an array of parameters, including the size of the in-transit in situ allocation, the simulation cycle time, and the scale of the simulation (up to 32,768 cores and 64 billion total cells). We then analyze this corpus of data and draw conclusions about when each paradigm is the fastest. Our findings show that in-transit is faster than in-line when inter-process communication was high (up to 35% more efficient) and when our computation-bound algorithm was run at large scale (up to 47% more efficient). On the other hand, in-line was faster with our computation-bound algorithm and a short simulation cycle time (up to 42% more efficient). Finally, this work informs future directions for understanding other classes of in situ visualization algorithms.