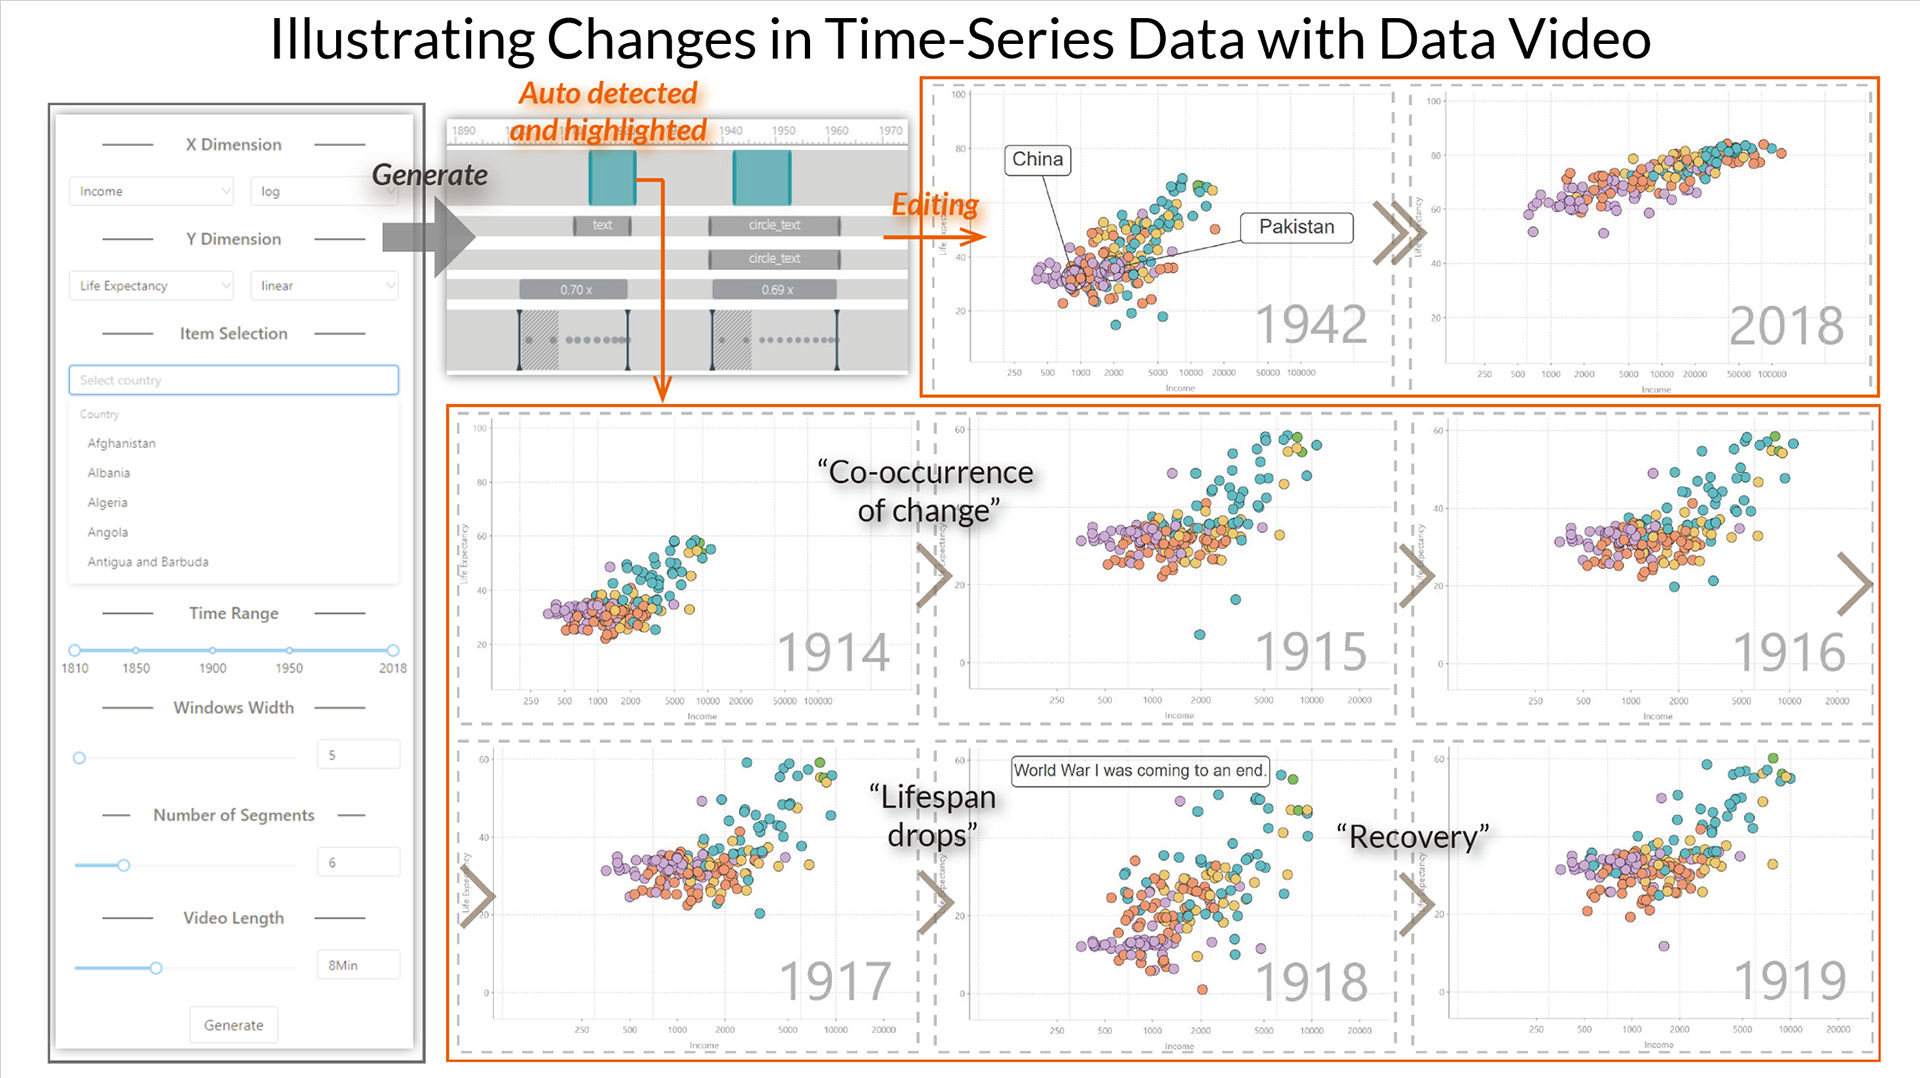
Illustrating Changes in Time-Series Data With Data Video
Junhua Lu, Jie Wang, Hui Ye, Yuhui Gu, Zhiyu Ding, Mingliang Xu, Wei Chen
External link (DOI)
View presentation:2020-10-28T16:30:00ZGMT-0600Change your timezone on the schedule page
2020-10-28T16:30:00Z

Fast forward
Direct link to video on YouTube: https://youtu.be/oRW_TO3iwJg
Keywords
Videos, Data visualization, Video sequences, Visual effects, Animation
Abstract
Understanding the changes of time-series is a common task in many application domains. Converting time-series data into videos helps an audience with little or no background knowledge gain insights and deep impressions. It essentially integrates data visualizations and animations to present the evolution of data expressively. However, it remains challenging to create this kind of data video. First, it is difficult to efficiently detect important changes and include them in the video sequence. Existing methods require much manual effort to explore the data and find changes. Second, how these changes are emphasized in the videos is also worth studying. A video without emphasis will hinder an audience from noticing those important changes. This article presents an approach that extracts and visualizes important changes of a time-series. Users can explore and modify these changes, and apply visual effects on them. Case studies and user feedback demonstrate the effectiveness and usability of our approach.