StructGraphics: Flexible Visualization Design through Data-Agnostic and Reusable Graphical Structures
Theophanis Tsandilas
External link (DOI)
View presentation:2020-10-27T18:30:00ZGMT-0600Change your timezone on the schedule page
2020-10-27T18:30:00Z
Fast forward
Direct link to video on YouTube: https://youtu.be/1CAfAmzC4z0
Keywords
Visualization design, graphical structures, visualization grammars, layout constraints, infographics, flexible data binding
Abstract
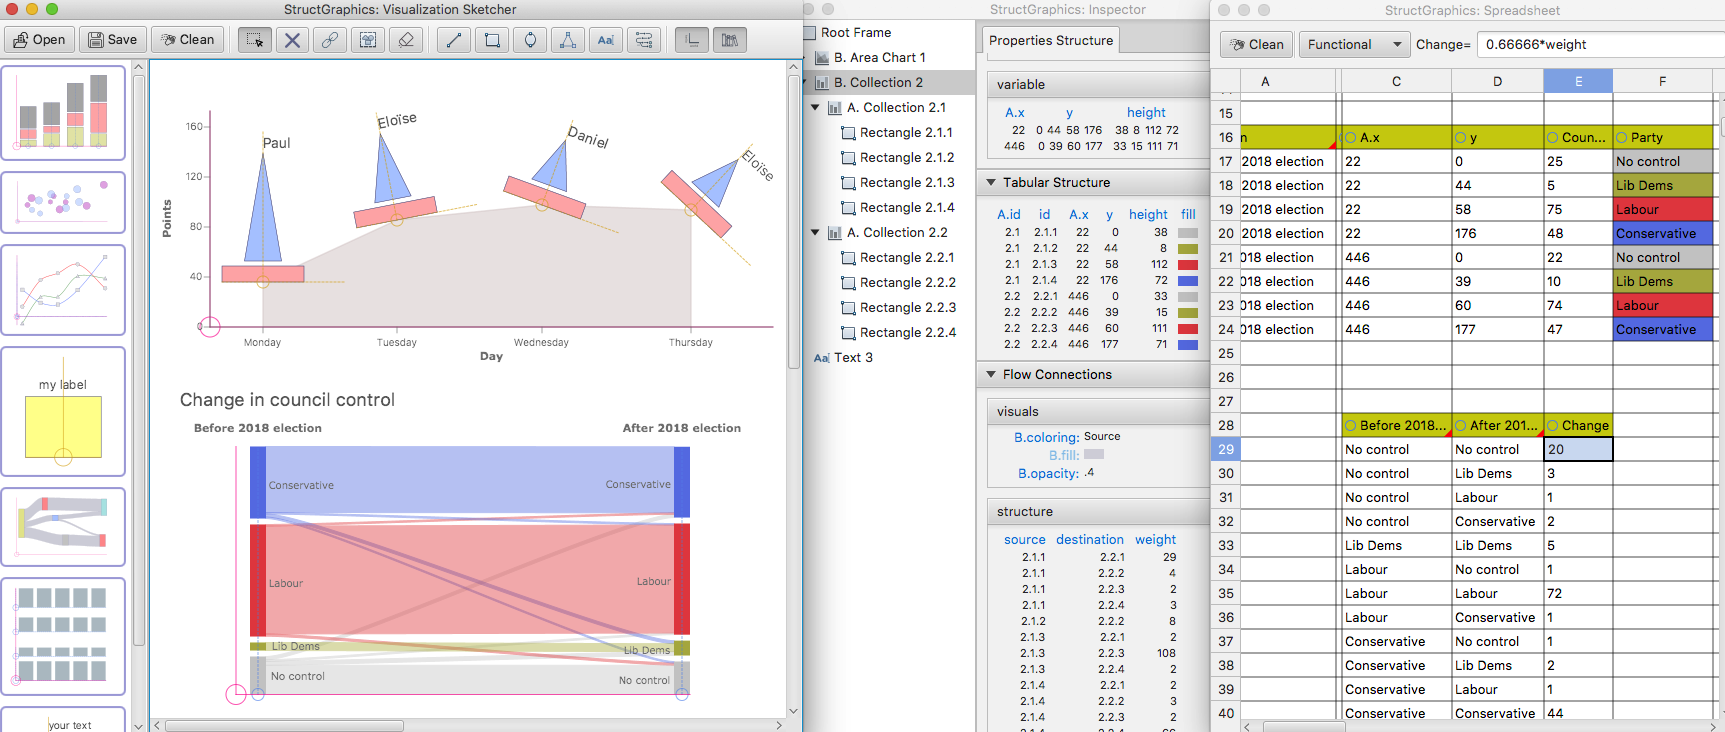
Information visualization research has developed powerful systems that enable users to author custom data visualizations without textual programming. These systems can support graphics-driven practices by bridging lazy data-binding mechanisms with vector-graphics editing tools. Yet, despite their expressive power, visualization authoring systems often assume that users want to generate visual representations that they already have in mind rather than explore designs. They also impose a data-to-graphics workflow, where binding data dimensions to graphical properties is a necessary step for generating visualization layouts. In this paper, we introduce StructGraphics, an approach for creating data-agnostic and fully reusable visualization designs. StructGraphics enables designers to construct visualization designs by drawing graphics on a canvas and then structuring their visual properties without relying on a dataset or data schema. In StructGraphics, tabular data structures are derived directly from the structure of the graphics. Later, designers can link these structures with real datasets through a spreadsheet user interface. StructGraphics supports the design and reuse of complex data visualizations by combining graphical property sharing, by-example design specification, and persistent layout constraints. We demonstrate the power of the approach through a gallery of visualization examples and reflect on its strengths and limitations in interaction with graphic designers and data visualization experts.