Honorable Mention
A Simple Pipeline for Coherent Grid Maps
Wouter Meulemans, Max Sondag, Bettina Speckmann
External link (DOI)
View presentation:2020-10-29T16:15:00ZGMT-0600Change your timezone on the schedule page
2020-10-29T16:15:00Z
Fast forward
Direct link to video on YouTube: https://youtu.be/ve7qn0VDyUg
Keywords
Grid maps Algorithms Tile maps Small multiples Geovisualization
Abstract
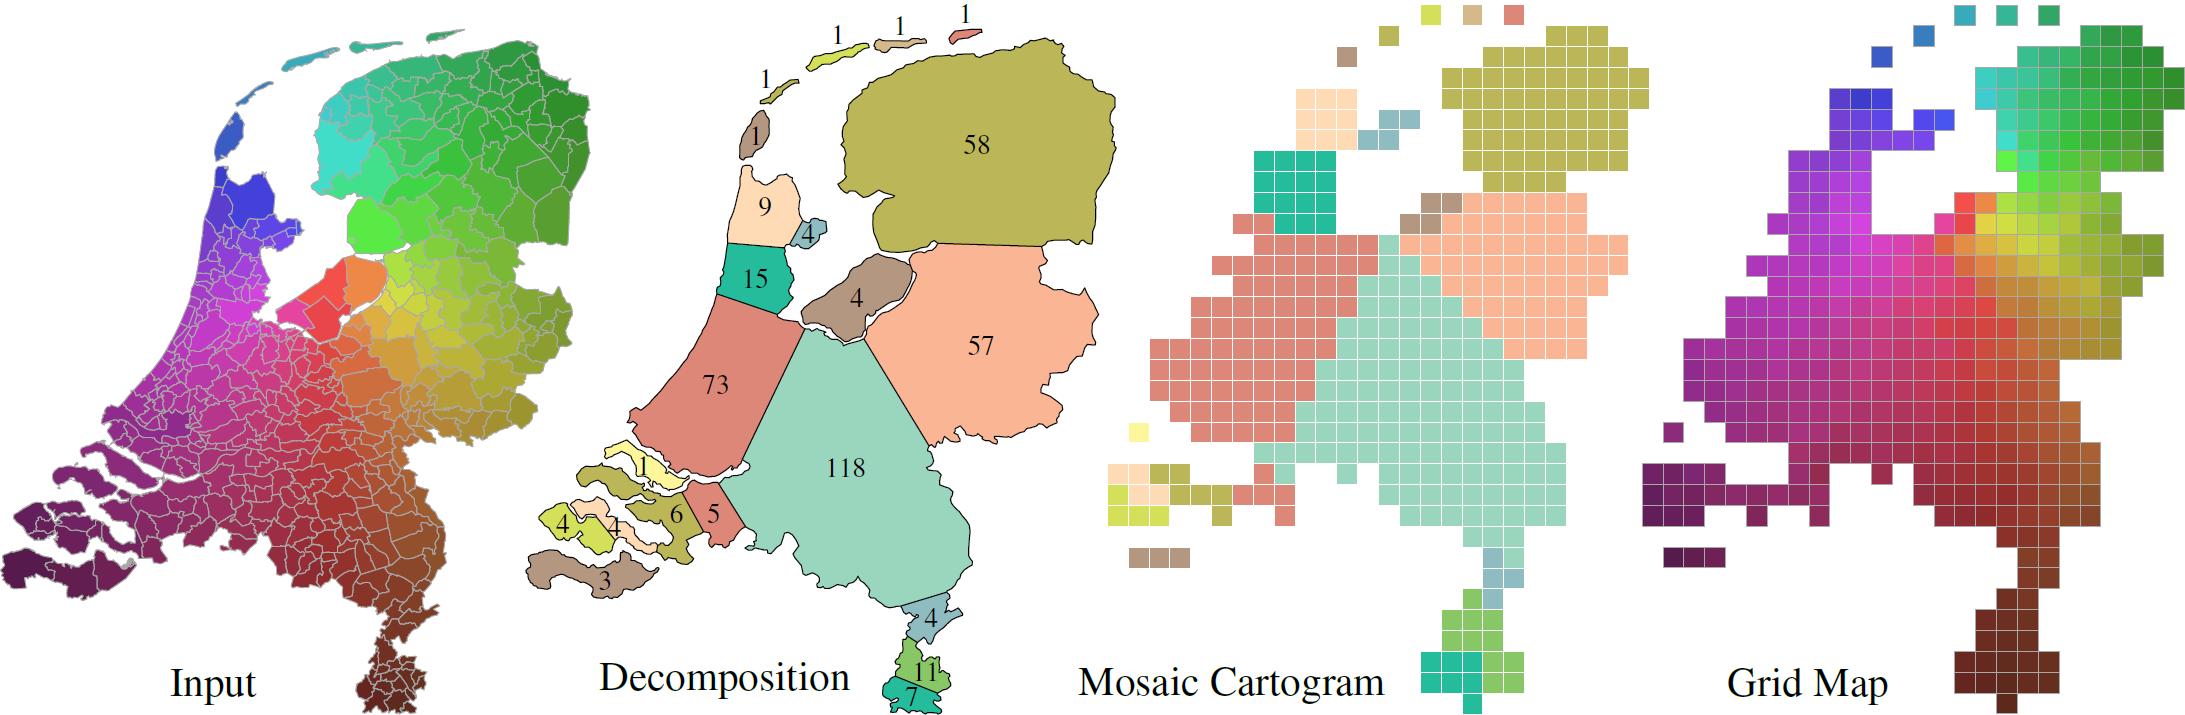
Grid maps are spatial arrangements of simple tiles (often squares or hexagons), each of which represents a spatial element. They are an established, effective way to show complex data per spatial element, using visual encodings within each tile ranging from simple coloring to nested small-multiples visualizations. An effective grid map is coherent with the underlying geographic space: the tiles maintain the contiguity, neighborhoods and identifiability of the corresponding spatial elements, while the grid map as a whole maintains the global shape of the input. Of particular importance are salient local features of the global shape which need to be represented by tiles assigned to the appropriate spatial elements. State-of-the-art techniques can adequately deal only with simple cases, such as close-to-uniform spatial distributions or global shapes that have few characteristic features. We introduce a simple fully-automated 3-step pipeline for computing coherent grid maps. Each step is a well-studied problem: shape decomposition based on salient features, tile-based Mosaic Cartograms, and point-set matching. Our pipeline is a seamless composition of existing techniques for these problems and results in high-quality grid maps. We provide an implementation, demonstrate the efficacy of our approach on various complex datasets, and compare it to the state-of-the-art.