Revealing Perceptual Proxies with Adversarial Examples
Brian Ondov, Fumeng Yang, Matthew Kay, Niklas Elmqvist, Steven Franconeri
External link (DOI)
View presentation:2020-10-27T19:15:00ZGMT-0600Change your timezone on the schedule page
2020-10-27T19:15:00Z
Keywords
perceptual proxies, vision science, crowdsourced evaluation
Abstract
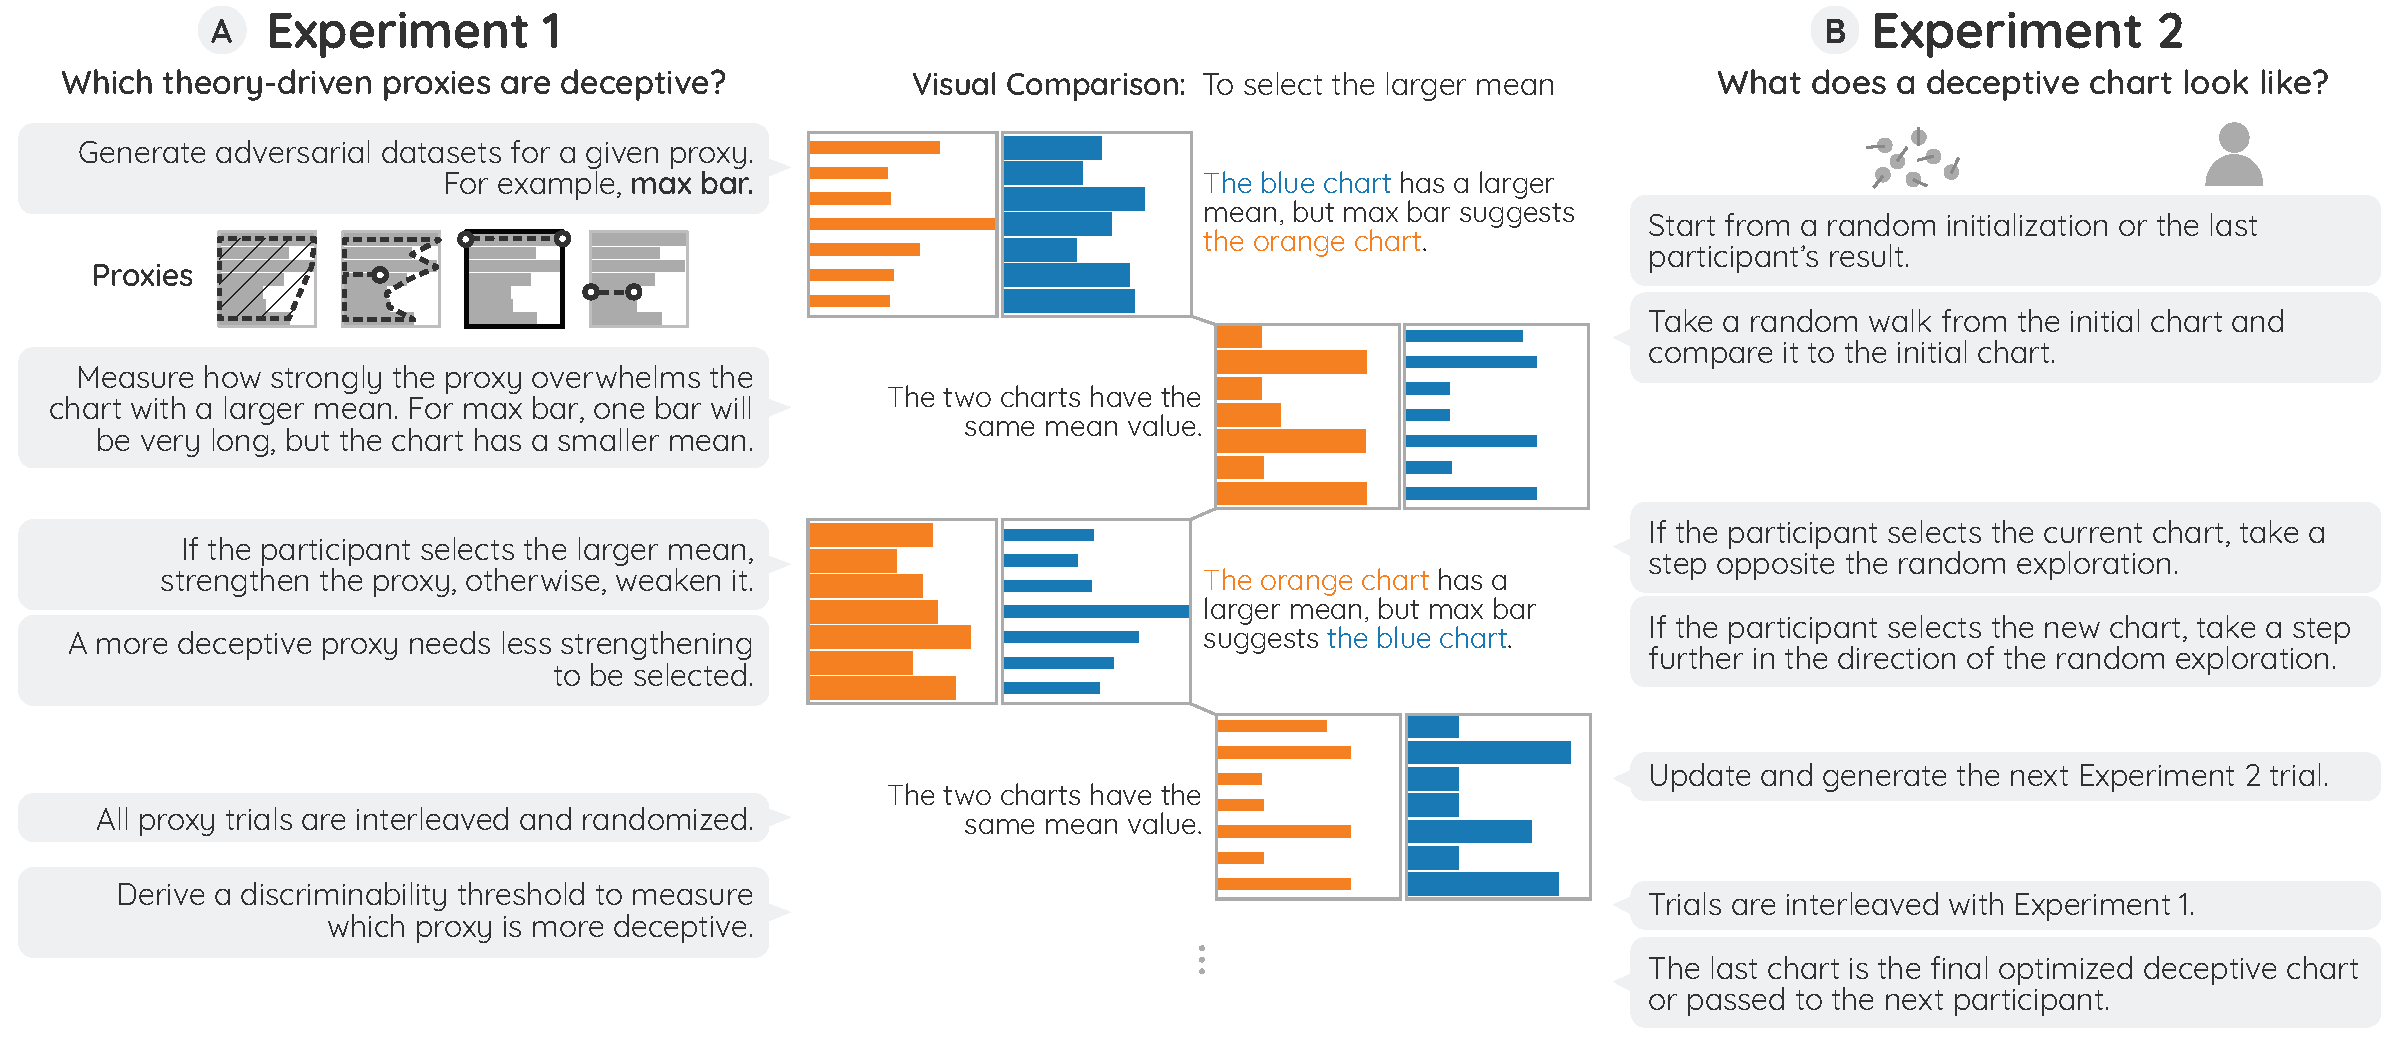
Data visualizations convert numbers into visual marks so that our visual system can extract data from an image instead of raw numbers. Clearly, the visual system does not compute these values as a computer would, e.g., by calculating an arithmetic mean or a correlation. Instead, it extracts these patterns using perceptual proxies; heuristic shortcuts of the visual marks, such as a center of mass or a shape envelope. Understanding which proxies people actually use would lead to more effective visualizations. We present the results of a series of crowdsourced experiments that measure how powerfully a set of candidate proxies can explain human performance when comparing the mean and range of pairs of data series presented as bar charts. We generated datasets where the correct answer—the series with the higher arithmetic mean or range—was pitted against an “adversarial” series that should be seen as higher if the viewer uses a particular candidate proxy. Using a staircase design, we sought metrics of how strongly each adversarial proxy could drive viewers to answer incorrectly, yielding evidence for whether that proxy is consistent with the viewer's actual practice. We then use hierarchical modeling to investigate whether different individuals may choose different proxies. Finally, we attempt to construct adversarial datasets from scratch, using an iterative crowdsourcing procedure to perform black-box optimization.