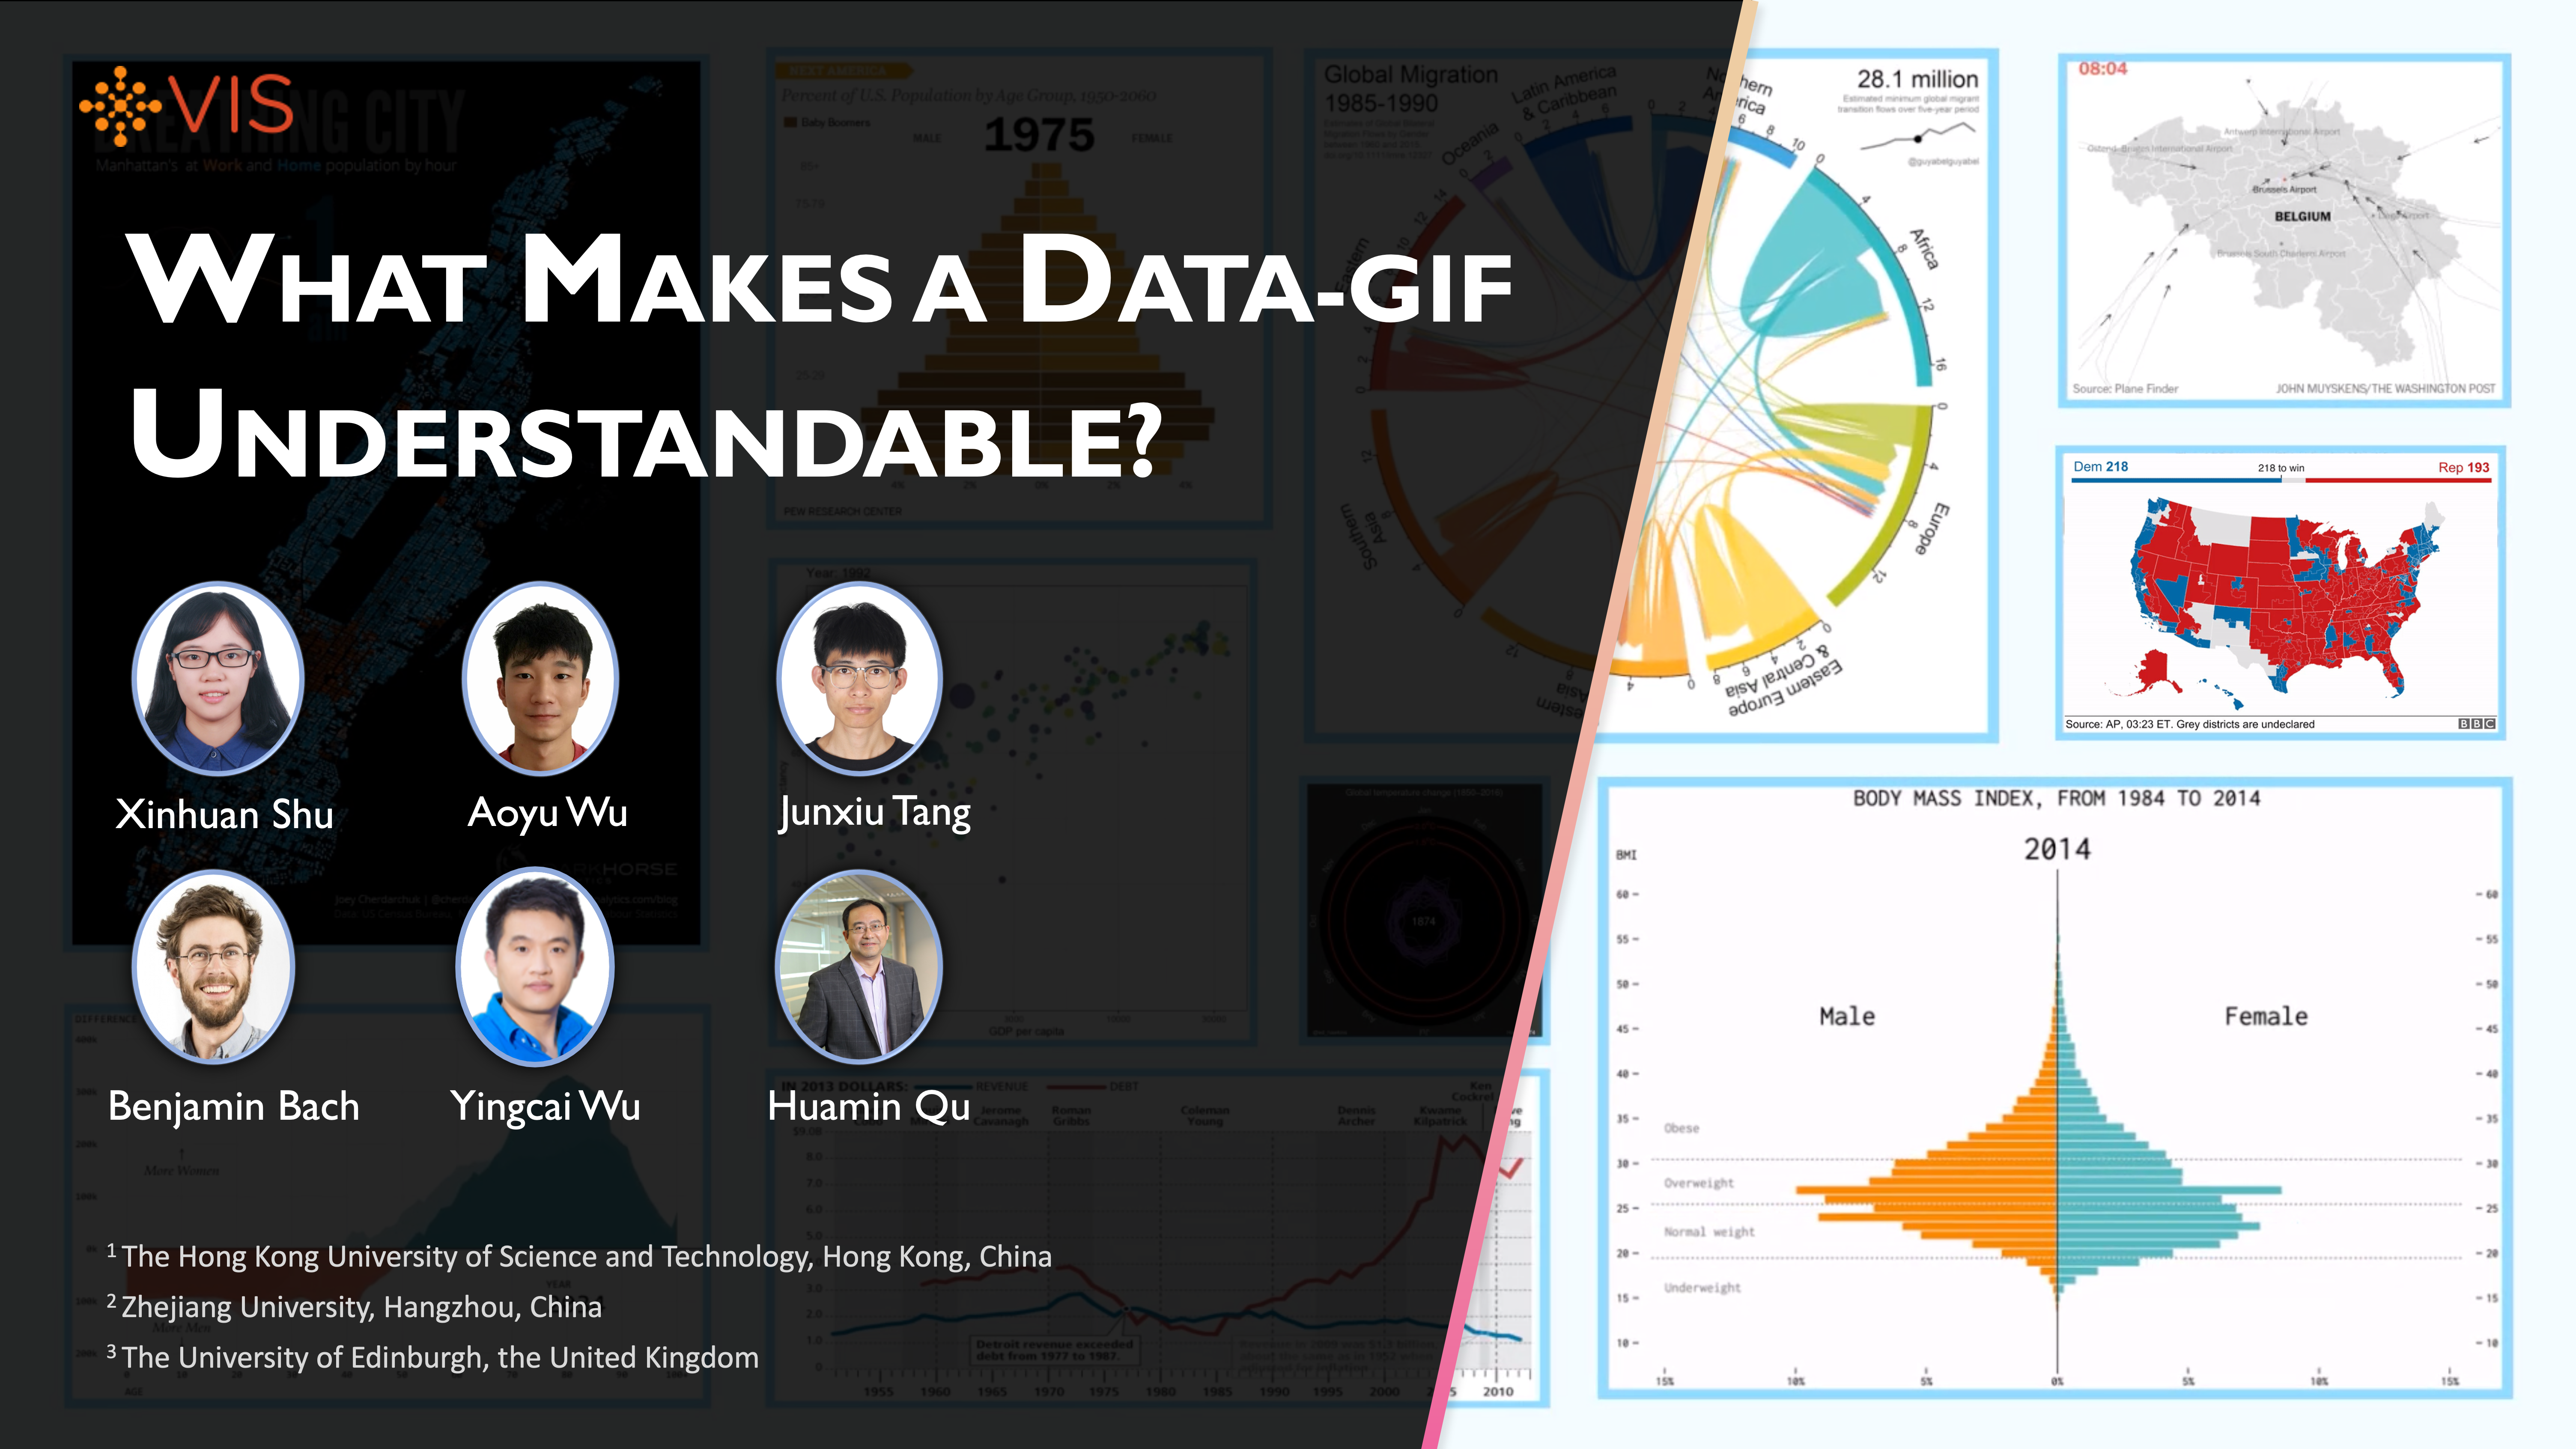
What Makes a Data-GIF Understandable?
Xinhuan Shu, Aoyu Wu, Junxiu Tang, Benjamin Bach, Yingcai Wu, Huamin Qu
External link (DOI)
View presentation:2020-10-29T14:00:00ZGMT-0600Change your timezone on the schedule page
2020-10-29T14:00:00Z
Fast forward
Direct link to video on YouTube: https://youtu.be/vs3iucWl0qI
Keywords
Data-GIFs, Data-driven Storytelling, Evaluation
Abstract
GIFs are enjoying increasing popularity on social media as a format for data-driven storytelling with visualization; simple visual messages are embedded in short animations that usually last less than 15 seconds and are played in automatic repetition. In this paper, we ask the question, "What makes a data-GIF understandable?" While other storytelling formats such as data videos, infographics, or data comics are relatively well studied, we have little knowledge about the design factors and principles for "data-GIFs". To close this gap, we provide results from semi-structured interviews and an online study with a total of 118 participants investigating the impact of design decisions on the understandability of data-GIFs. The study and our consequent analysis are informed by a systematic review and structured design space of 108 data-GIFs that we found online. Our results show the impact of design dimensions from our design space such as animation encoding, context preservation, or repetition on viewers' understanding of the GIF's core message. The paper concludes with a list of suggestions for creating more effective Data-GIFs.