Investigating Visual Analysis of Differentially Private Data
Dan Zhang, Ali Sarvghad, Gerome Miklau
External link (DOI)
View presentation:2020-10-30T15:15:00ZGMT-0600Change your timezone on the schedule page
2020-10-30T15:15:00Z
Fast forward
Direct link to video on YouTube: https://youtu.be/bI2dRiKFxck
Keywords
Differential Privacy, Information Visualization
Abstract
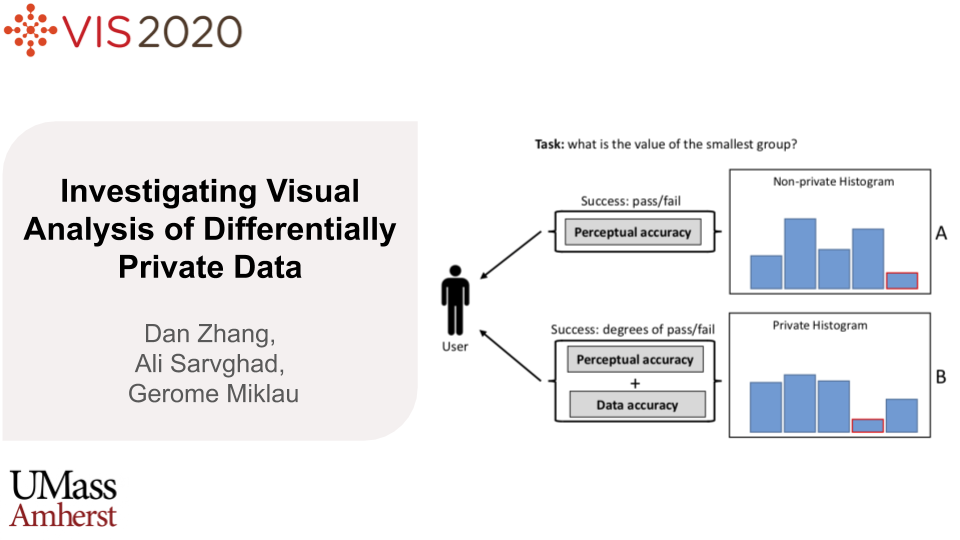
Differential Privacy is an emerging privacy model with increasing popularity in many domains. It functions by adding carefullycalibrated noise to data that blurs information about individuals while preserving overall statistics about the population. Theoretically,it is possible to produce robust privacy-preserving visualizations by plotting differentially private data. However, noise-induceddata perturbations can alter visual patterns and impact the utility of private visualization. We still know little about challenges andopportunities for visual data exploration and analysis using private visualizations. As a first step towards filling this gap, we conducted acrowdsourced experiment, measuring participants' performance under three levels of privacy (high, low, non-private) for combinationsof eight analysis tasks and four visualization types (bar chart, pie chart, line chart, scatter plot). Our findings show that for participants'accuracy for summary tasks (e.g., find clusters in data) was higher that value tasks (e.g., retrieve a certain value). We also found thatunder DP, pie chart and line chart offer similar or better accuracy than bar chart. In this work, we contribute the results of our empiricalstudy, investigating the task-based effectiveness of basic private visualizations, a dichotomous model for defining and measuring usersuccess in performing visual analysis tasks under DP, and a set of distribution metrics for tuning the injection to improve the utility ofprivate visualizations