Palettailor: Discriminable Colorization for Categorical Data
Kecheng Lu, Mi Feng, Xin Chen, Michael Sedlmair, Oliver Deussen, Dani Lischinski, Zhanglin Cheng, Yunhai Wang
External link (DOI)
View presentation:2020-10-29T18:45:00ZGMT-0600Change your timezone on the schedule page
2020-10-29T18:45:00Z
Fast forward
Direct link to video on YouTube: https://youtu.be/L_8mE_xTf1c
Keywords
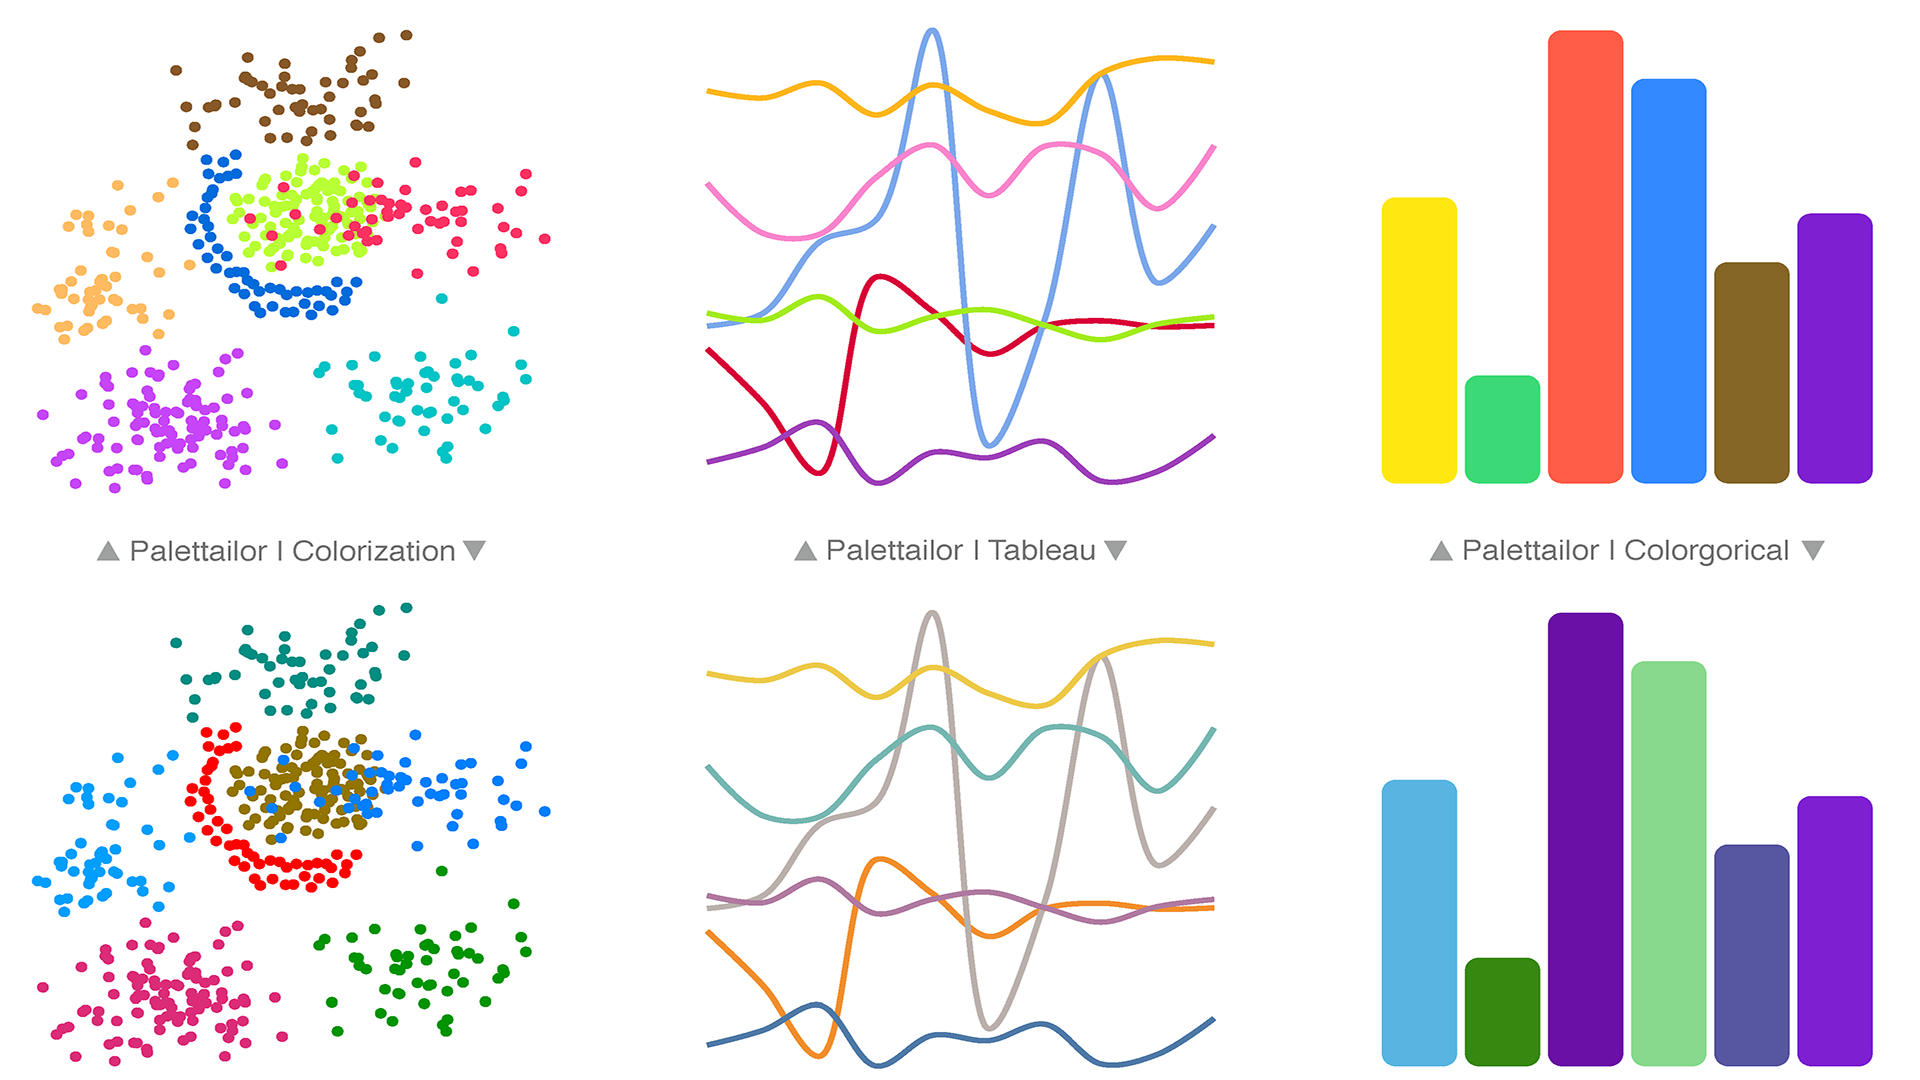
Color Palette, Discriminability, Multi-Class Scatterplot, Line Chart, Bar Chart
Abstract
We present an integrated approach for creating and assigning color palettes to different visualizations such as multi-class scatterplots, line, and bar charts. Other approaches separate the creation of colors from their assignment. In contrast, our approach takes data characteristics already into account to produce color palettes, which are then assigned in a way that fosters better visual discrimination of classes. To do so, we use a customized optimization based on simulated annealing to maximize the combination of three carefully designed color scoring functions: point distinctness, name difference, and color discrimination. We compared our approach to state-of-the-art palettes with a controlled user study for scatterplots and line charts and performed a case study. Our results show that Palettailor, as a fully-automated approach, generates color palettes with a higher discrimination quality than existing approaches. The efficiency of our optimization allows us also to incorporate user modifications into the color selection process.