Data-Driven Space-Filling Curves
Liang Zhou, Chris R. Johnson, Daniel Weiskopf
External link (DOI)
View presentation:2020-10-30T17:15:00ZGMT-0600Change your timezone on the schedule page
2020-10-30T17:15:00Z
Fast forward
Direct link to video on YouTube: https://youtu.be/gEujag3akYw
Keywords
Space-filling curves, comparative visualization, ensemble visualization, multivariate visualization
Abstract
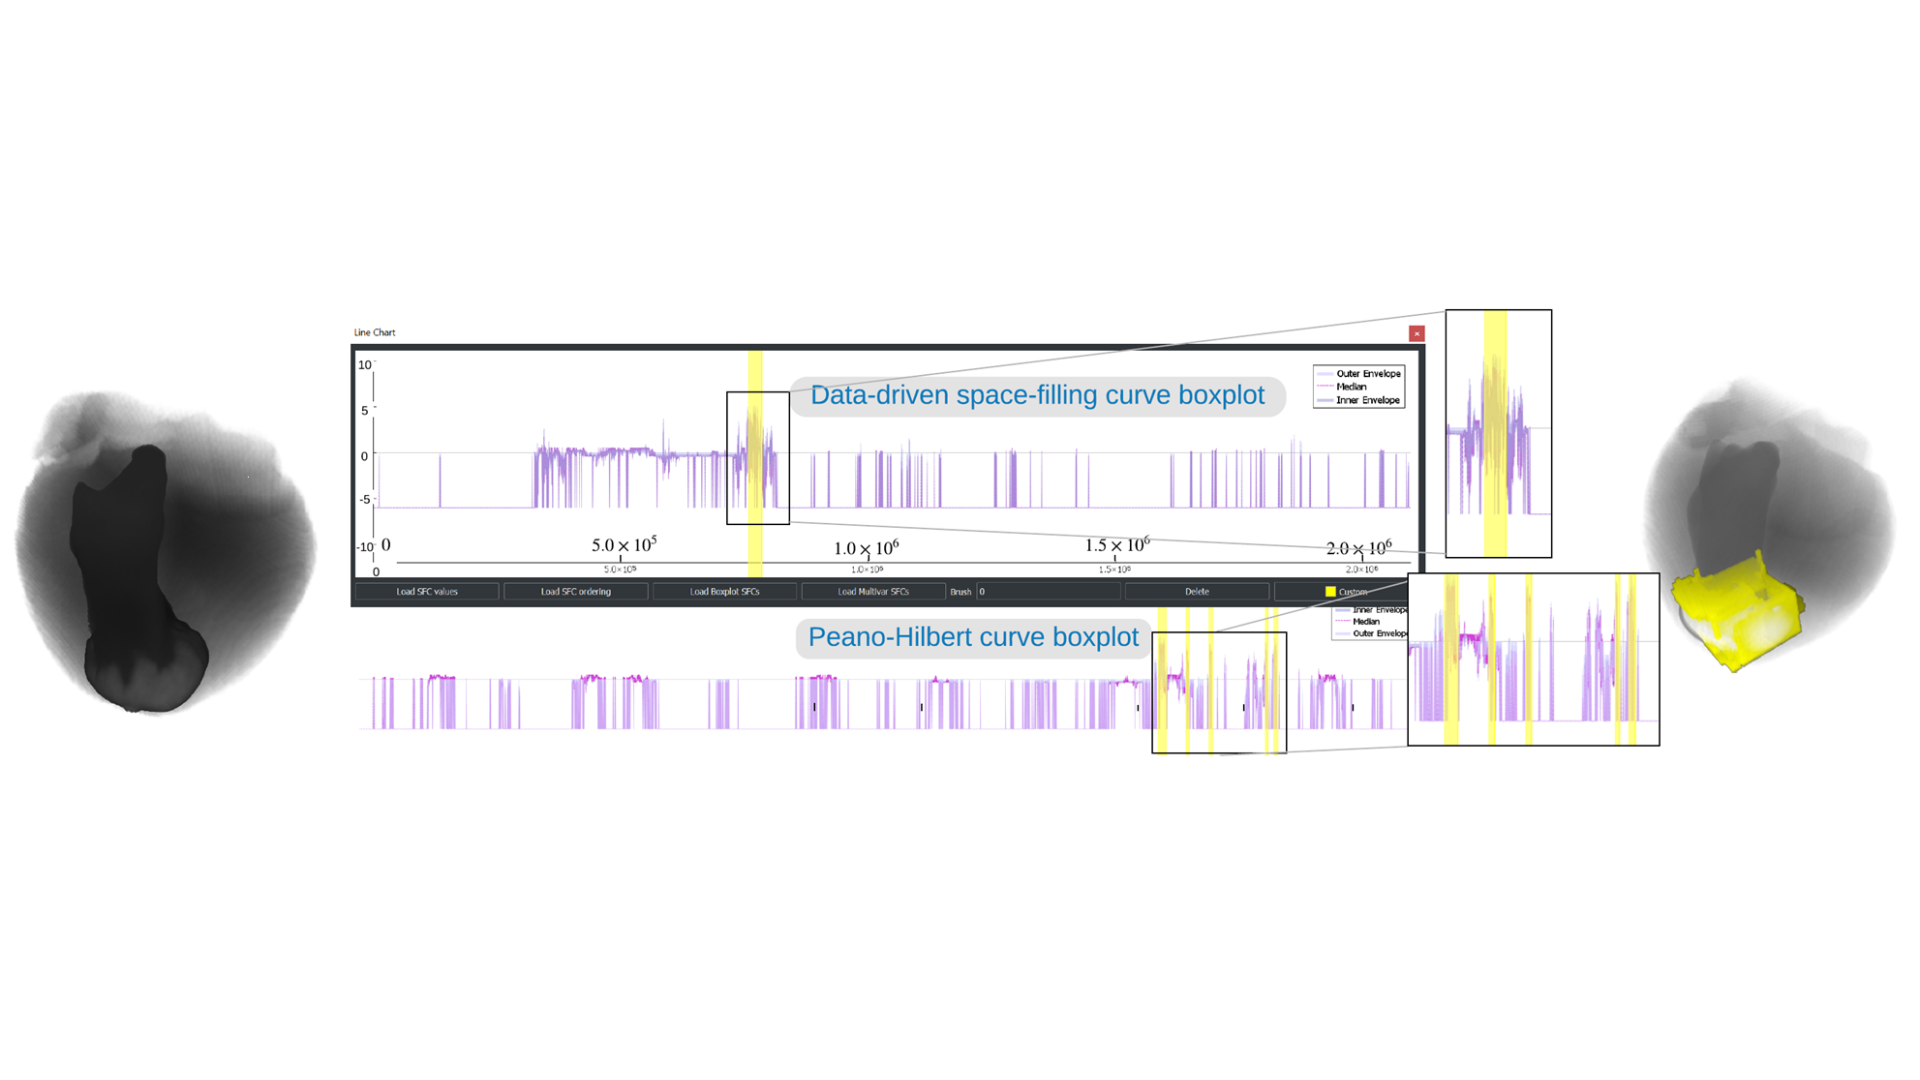
We propose a data-driven space-filling curve method for 2D and 3D visualization. Our flexible data-driven space-filling curve traverses the data elements in the spatial domain in a way that the resulting linearization better preserves features in space compared to existing methods. We achieve such data coherency by calculating a Hamiltonian path that approximately minimizes an objective function that describes the similarity of data values and location coherency in a neighborhood. Our extended variant even supports multiscale data via quadtrees and octrees. Our method is useful in many areas of visualization, including multivariate or comparative visualization, ensemble visualization of 2D and 3D data on regular grids, or multiscale visual analysis of particle simulations. The effectiveness of our method is evaluated with numerical comparisons to existing techniques and through examples of ensemble and multivariate datasets.