Phoenixmap: An Abstract Approach to Visualize 2D Spatial Distributions
Junhan Zhao, Xiang Liu, Chen Guo, Zhenyu Cheryl Qian, Yingjie Victor Chen
External link (DOI)
View presentation:2020-10-29T17:00:00ZGMT-0600Change your timezone on the schedule page
2020-10-29T17:00:00Z
Fast forward
Direct link to video on YouTube: https://youtu.be/qqoAb0b8YPY
Keywords
Data Visualization, Visualization, Algorithms, Geospatial Analysis
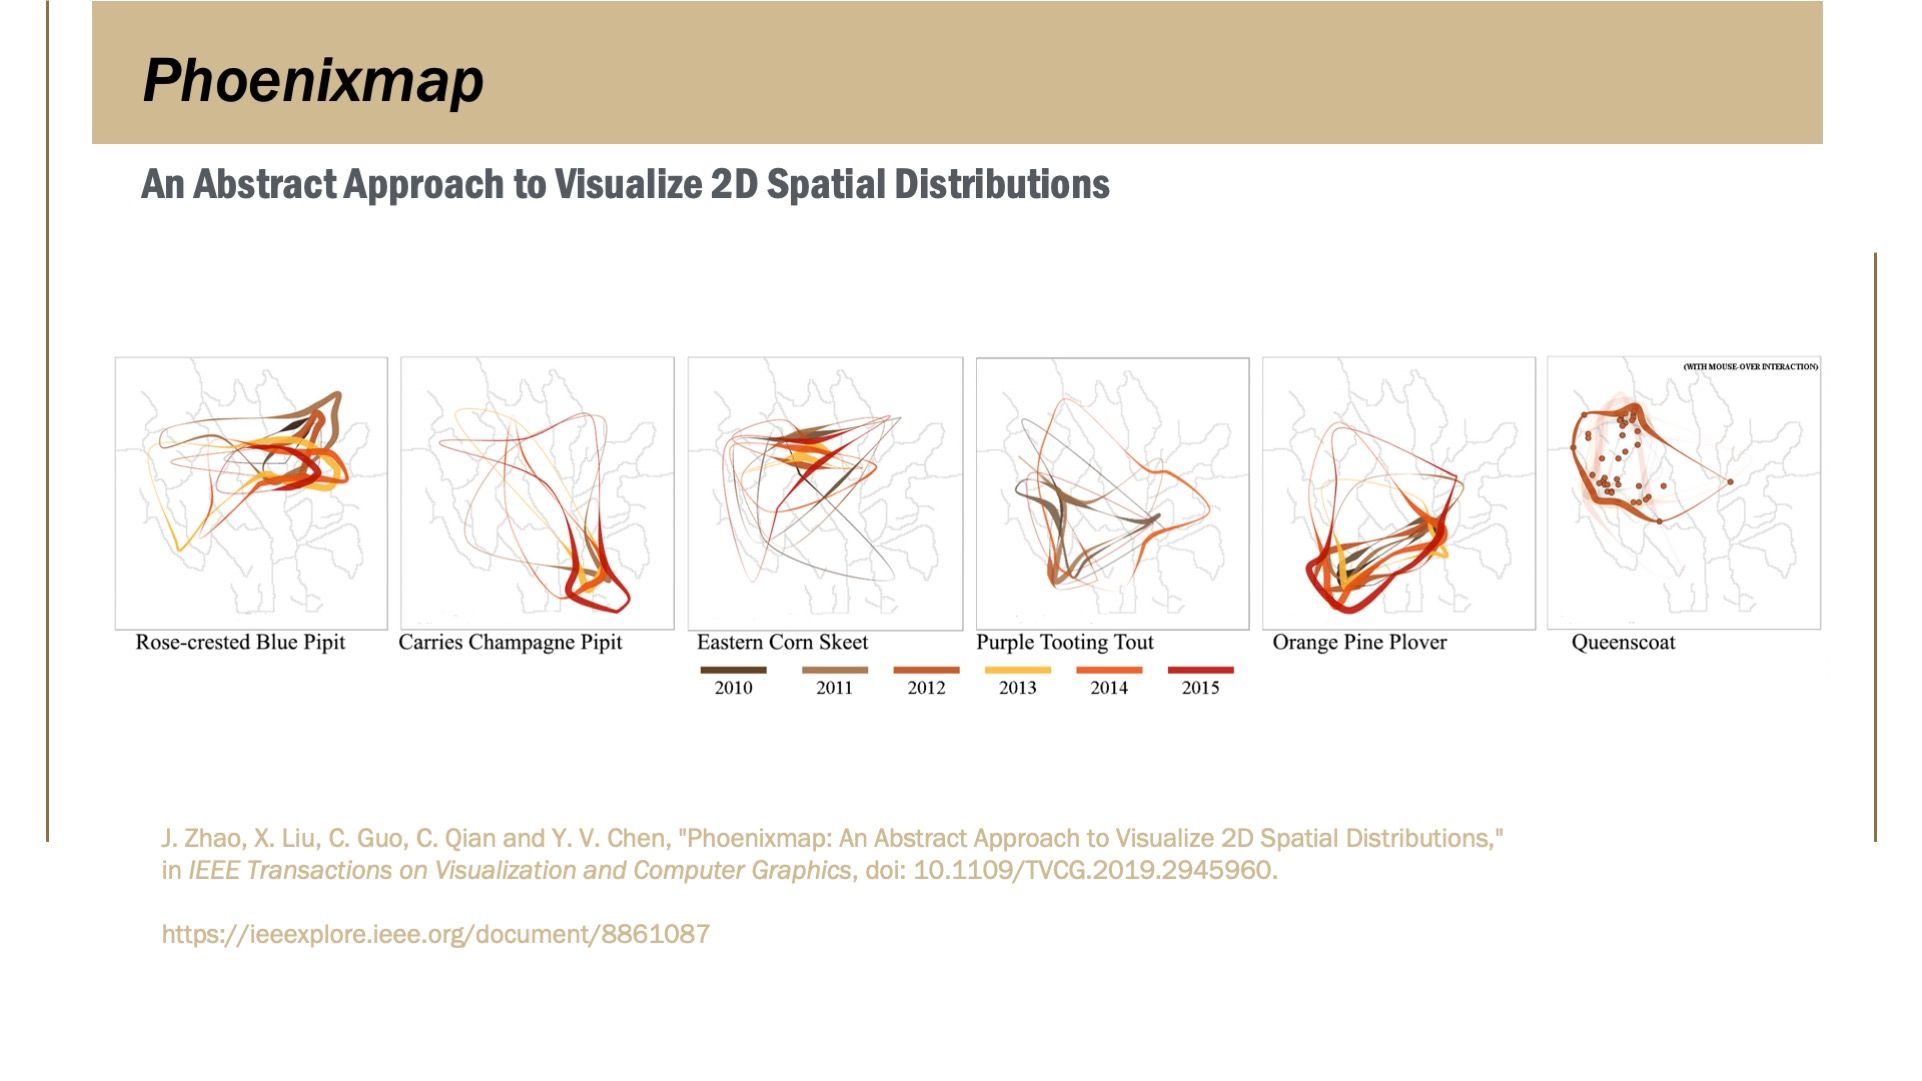
Abstract
The multidimensional nature of spatial data poses a challenge for visualization. In this paper, we introduce Phoenixmap, a simple abstract visualization method to address the issue of visualizing multiple spatial distributions at once. The Phoenixmap approach starts by identifying the enclosed outline of the point collection, then assigns different widths to outline segments according to the segments' corresponding inside regions. Thus, one 2D distribution is represented as an outline with varied thicknesses. Phoenixmap is capable of overlaying multiple outlines and comparing them across categories of objects in a 2D space. We chose heatmap as a benchmark spatial visualization method and conducted user studies to compare performances among Phoenixmap, heatmap, and dot distribution map. Based on the analysis and participant feedback, we demonstrate that Phoenixmap1) allows users to perceive and compare spatial distribution data efficiently; 2) frees up graphics space with a concise form that can provide broad visualization design possibilities like overlapping; and 3) provides a good quantitative perceptual estimating capability given the proper legends. Finally, we discuss several possible applications of Phoenixmapand present one visualization of multiple species of birds' active regions in a nature preserve.