Visual Analysis of Class Separations with Locally Linear Segments
Yuxin Ma, Ross Maciejewski
External link (DOI)
View presentation:2020-10-28T15:00:00ZGMT-0600Change your timezone on the schedule page
2020-10-28T15:00:00Z

Fast forward
Direct link to video on YouTube: https://youtu.be/Tav47cDynWg
Keywords
Visual analysis, Dimension reduction, Class separation
Abstract
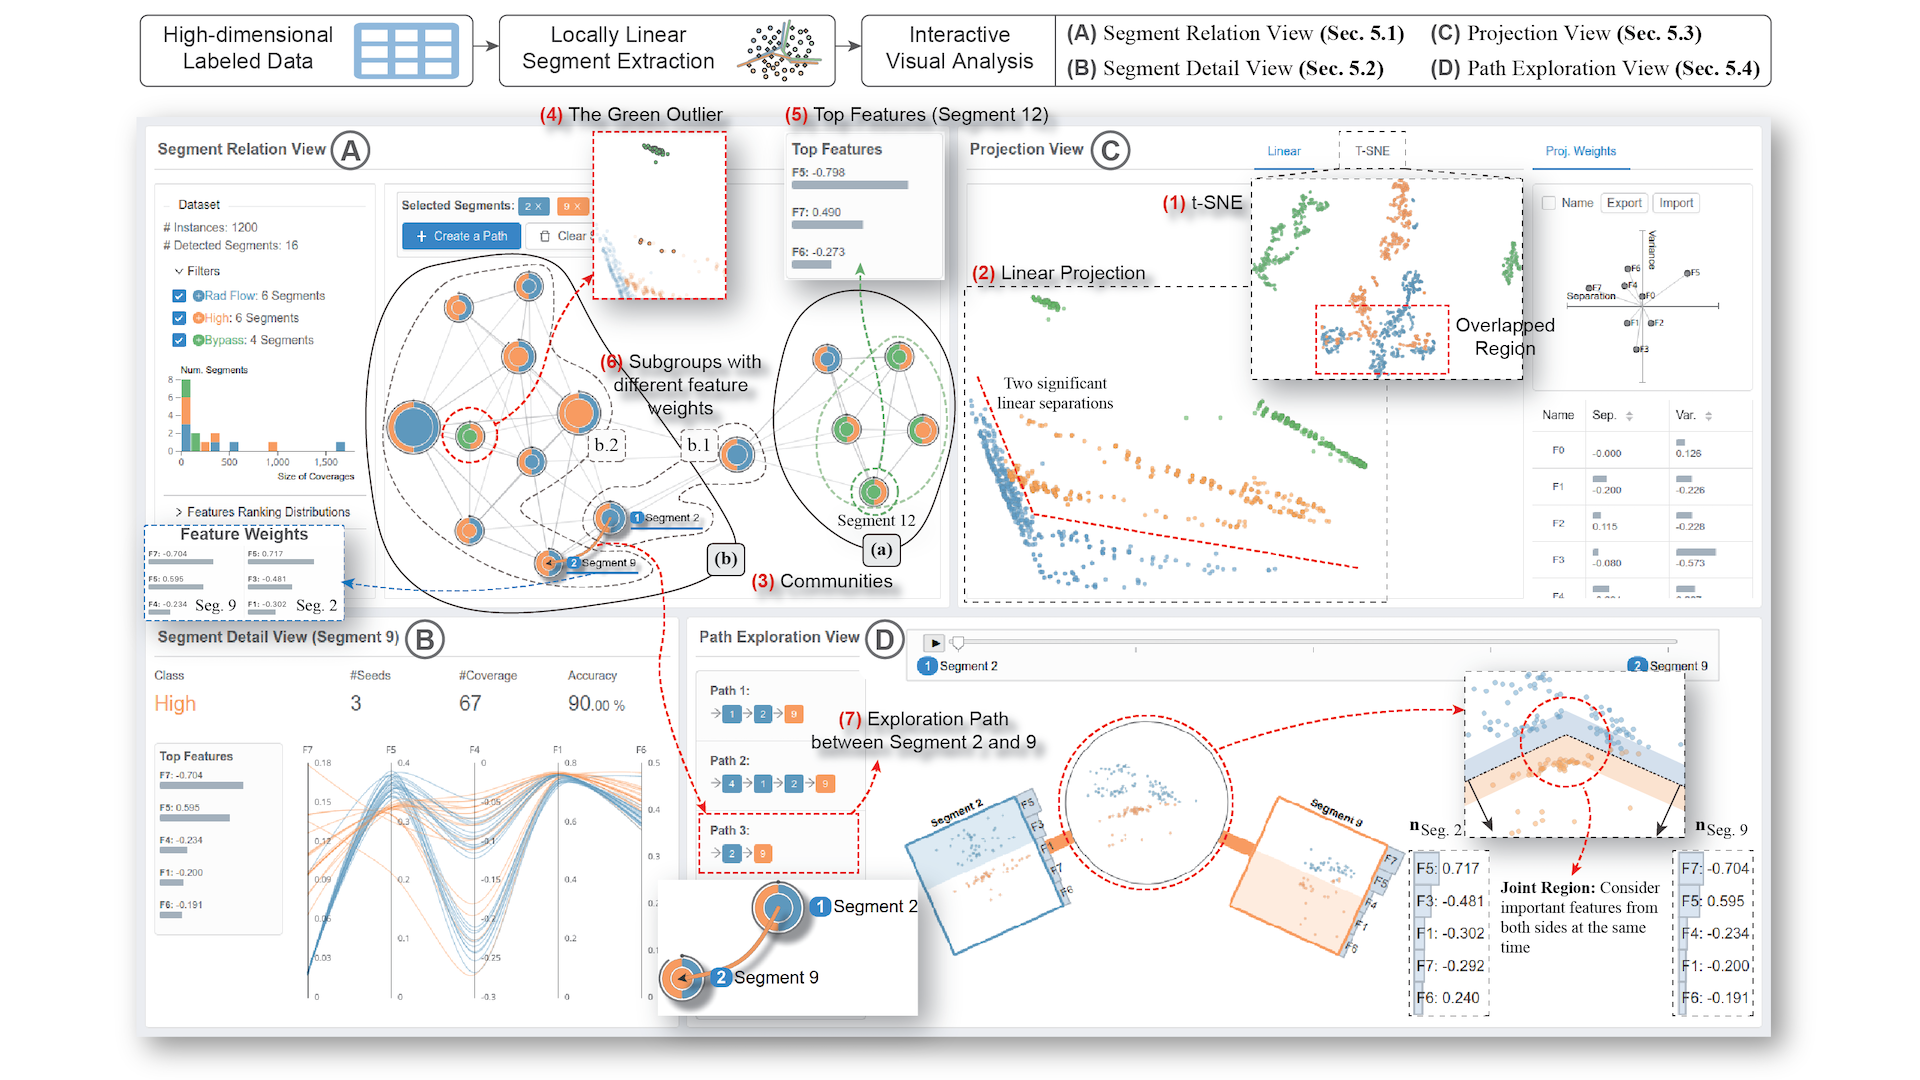
High-dimensional labeled data widely exists in many real-world applications such as classification and clustering. One main task in analyzing such datasets is to explore class separations and class boundaries derived from machine learning models. Dimension reduction techniques are commonly applied to support analysts in exploring the underlying decision boundary structures by depicting a low-dimensional representation of the data distributions from multiple classes. However, such projection-based analyses are limited due to their lack of ability to show separations in complex non-linear decision boundary structures and can suffer from heavy distortion and low interpretability. To overcome these issues of separability and interpretability,} we propose a visual analysis approach that utilizes the power of explainability from linear projections to support analysts when exploring non-linear separation structures. Our approach is to extract a set of locally linear segments that approximate the original non-linear separations. Unlike traditional projection-based analysis where the data instances are mapped to a single scatterplot, our approach supports the exploration of complex class separations through multiple local projection results. We conduct case studies on two labeled datasets to demonstrate the effectiveness of our approach.