AgentVis: Visual Analysis of Agent Behavior with Hierarchical Glyphs
Dylan Rees, Robert S Laramee, Paul Brookes, Tony D'Cruze, Gary A Smith, Aslam Miah
External link (DOI)
View presentation:2020-10-30T17:00:00ZGMT-0600Change your timezone on the schedule page
2020-10-30T17:00:00Z
Fast forward
Direct link to video on YouTube: https://youtu.be/Kn_6UhWnS_4
Keywords
glyph, clustering, multivariate visualization
Abstract
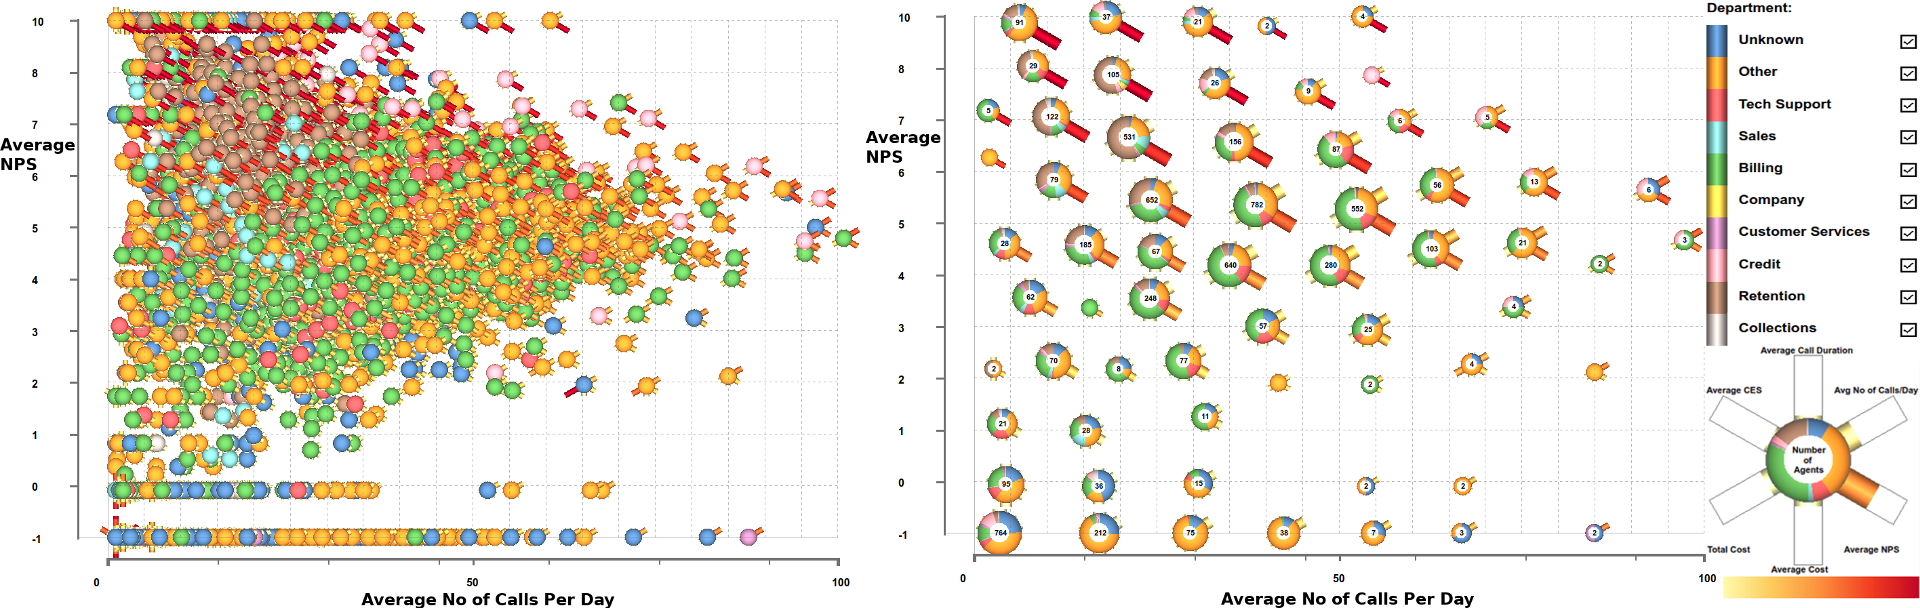
Glyphs representing complex behavior provide a useful and common means of visualizing multivariate data. However, due to their complex shape, overlapping and occlusion of glyphs is a common and prominent limitation. This limits the number of discreet data tuples that can be displayed in a given image. Using a real-world application, glyphs are used to depict agent behavior in a call center. However, many call centers feature thousands of agents. A standard approach representing thousands of agents with glyphs does not scale. To accommodate the visualization incorporating thousands of glyphs we develop clustering of overlapping glyphs into a single parent glyph. This hierarchical glyph represents the mean value of all child agent glyphs, removing overlap and reducing visual clutter. Multi-variate clustering techniques are explored and developed in collaboration with domain experts in the call center industry. We implement dynamic control of glyph clusters according to zoom level and customized distance metrics, to utilize image space with reduced overplotting and cluttering. We demonstrate our technique with examples and a usage scenario using real-world call-center data to visualize thousands of call center agents, revealing insight into their behavior and reporting feedback from expert call-center analysts.