Visualization of Blockchain Data: A Systematic Review
Natkamon Tovanich, Nicolas Heulot, Jean-Daniel Fekete, Petra Isenberg
External link (DOI)
View presentation:2020-10-30T16:30:00ZGMT-0600Change your timezone on the schedule page
2020-10-30T16:30:00Z
Fast forward
Direct link to video on YouTube: https://youtu.be/ddsavvDbaFI
Keywords
Blockchain, Bitcoin, Ethereum, Information Visualization, Visual Analytics, State-of-the-Art Survey
Abstract
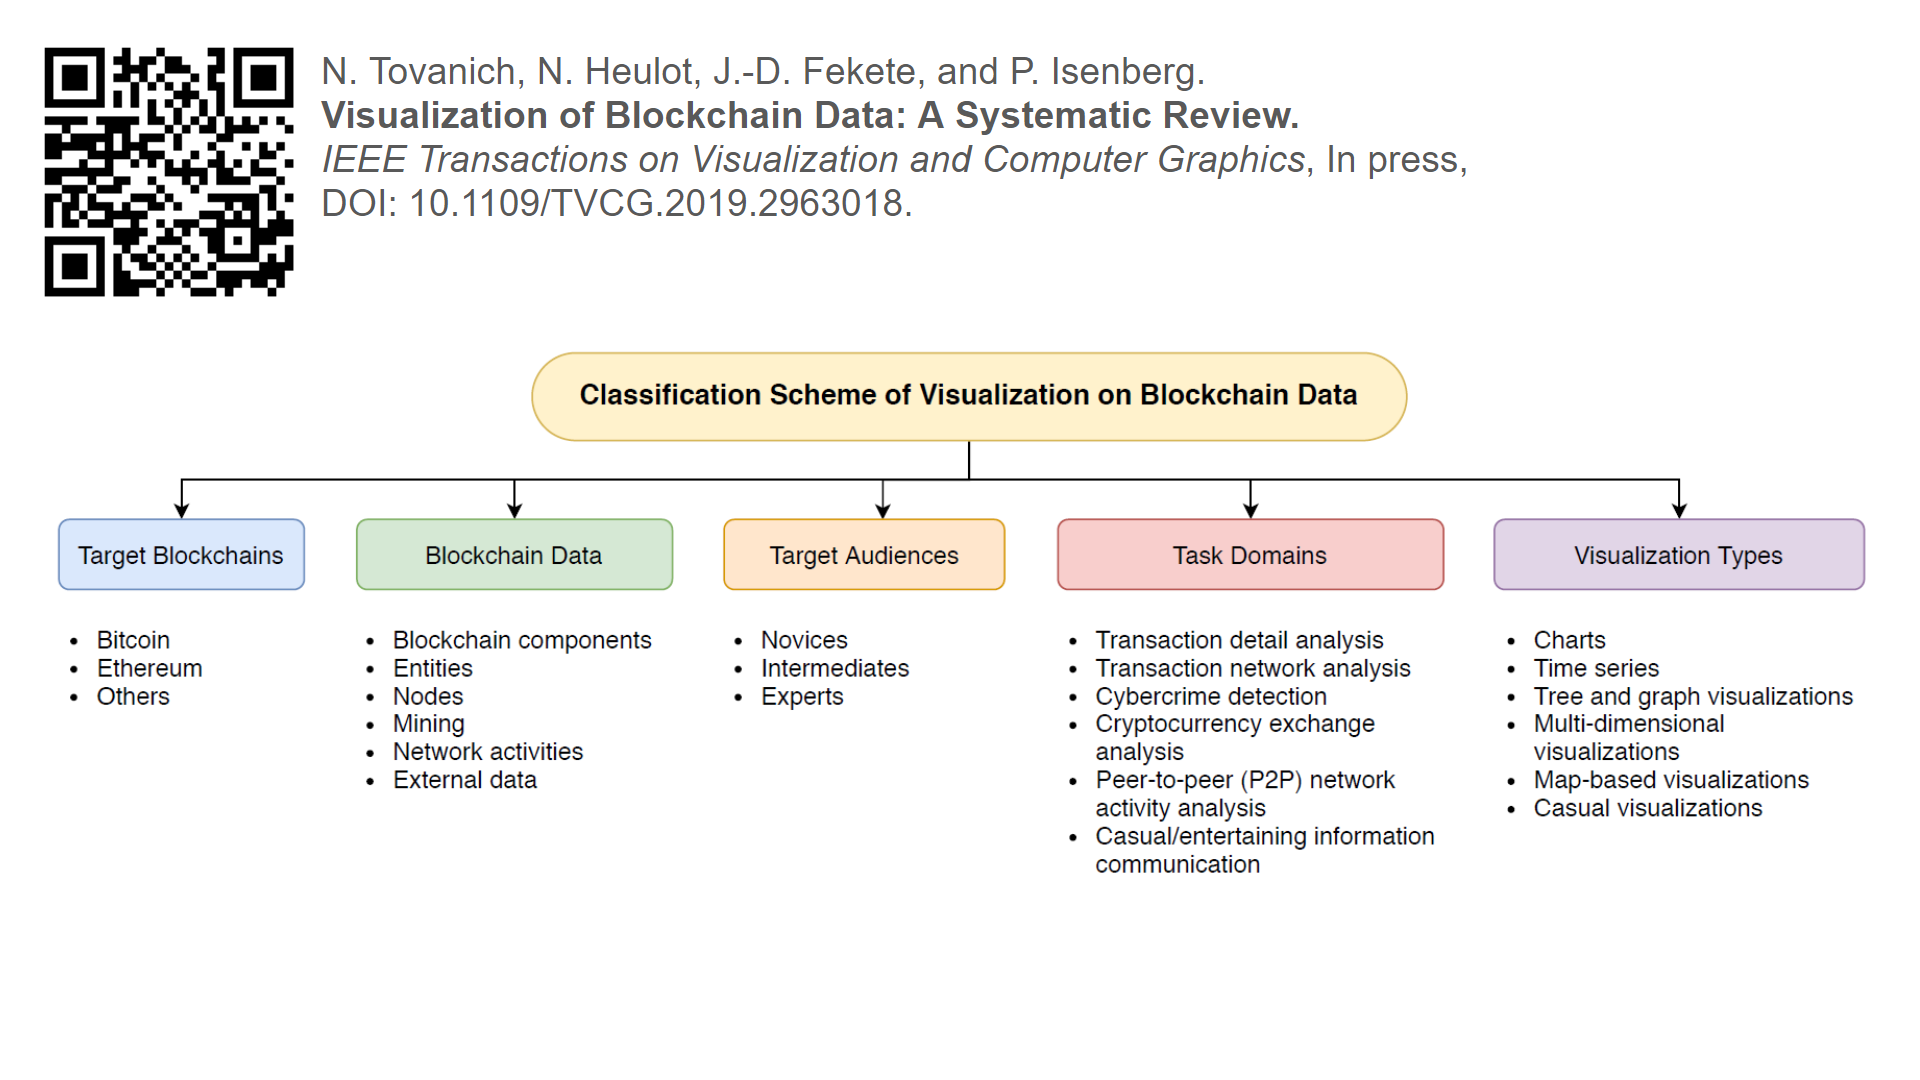
We present a systematic review of visual analytics tools used for the analysis of blockchains-related data. The blockchain concept has recently received considerable attention and spurred applications in a variety of domains. We systematically and quantitatively assessed 76 analytics tools that have been proposed in research as well as online by professionals and blockchain enthusiasts. Our classification of these tools distinguishes (1) target blockchains, (2) blockchain data, (3) target audiences, (4) task domains, and (5) visualization types. Furthermore, we look at which aspects of blockchain data have already been explored and point out areas that deserve more investigation in the future.