A Visual Analytics Approach for Exploratory Causal Analysis: Exploration, Validation, and Applications
Xiao Xie, Fan Du, Yingcai Wu
External link (DOI)
View presentation:2020-10-28T15:15:00ZGMT-0600Change your timezone on the schedule page
2020-10-28T15:15:00Z
Fast forward
Direct link to video on YouTube: https://youtu.be/hpNhFtKaSq8
Keywords
Exploratory causal analysis, Correlation and causation, Causal graph
Abstract
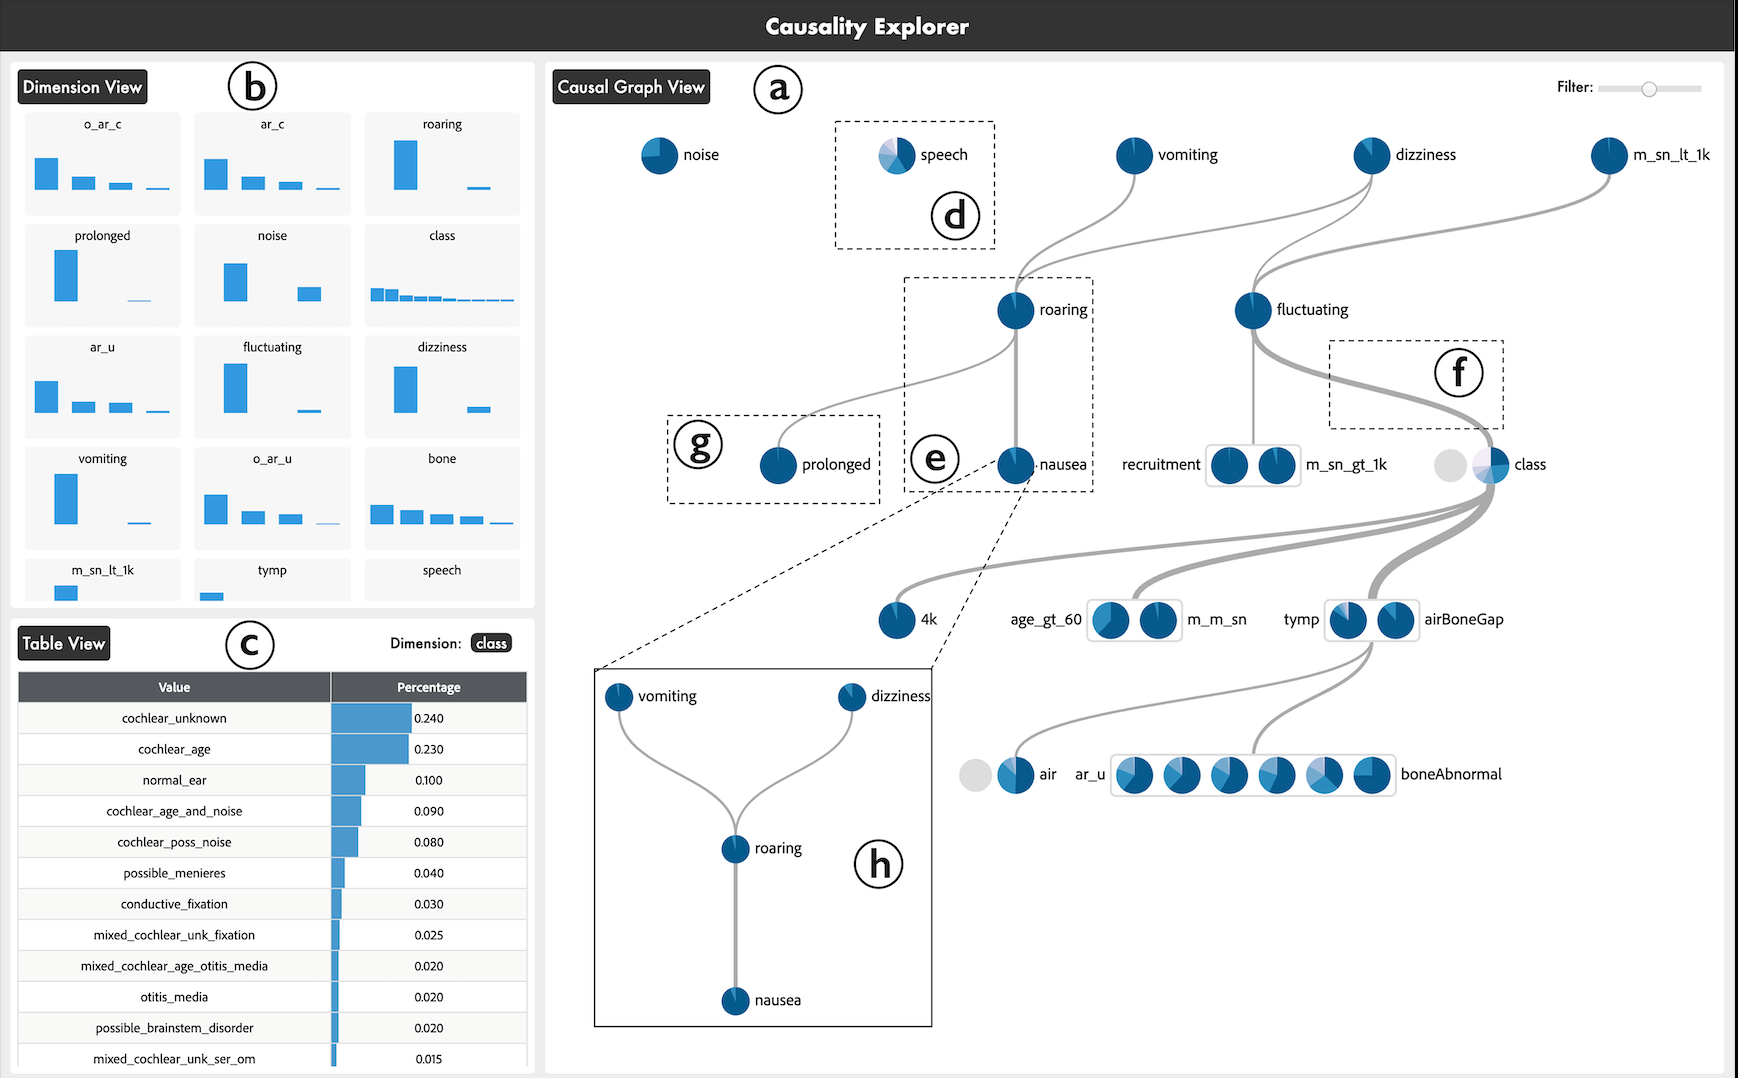
Using causal relations to guide decision making has become an essential analytical task across various domains, from marketing and medicine to education and social science. While powerful statistical models have been developed for inferring causal relations from data, domain practitioners still lack effective visual interface for interpreting the causal relations and applying them in their decision-making process. Through interview studies with domain experts, we characterize their current decision-making workflows, challenges, and needs. Through an iterative design process, we developed a visualization tool that allows analysts to explore, validate, and apply causal relations in real-world decision-making scenarios. The tool provides an uncertainty-aware causal graph visualization for presenting a large set of causal relations inferred from high-dimensional data. On top of the causal graph, it supports a set of intuitive user controls for performing what-if analyses and making action plans. We report on two case studies in digital marketing and student advising scenarios to demonstrate that users can effectively explore causal relations and iteratively design action plans for reaching their goals.