A Visual Analytics Framework for Contrastive Network Analysis
Takanori Fujiwara, Jian Zhao, Francine Chen, Kwan-Liu Ma
External link (DOI)
View presentation:2020-10-29T19:00:00ZGMT-0600Change your timezone on the schedule page
2020-10-29T19:00:00Z

Keywords
Contrastive learning, network representation learning, interpretability, network comparison, visual analytics
Abstract
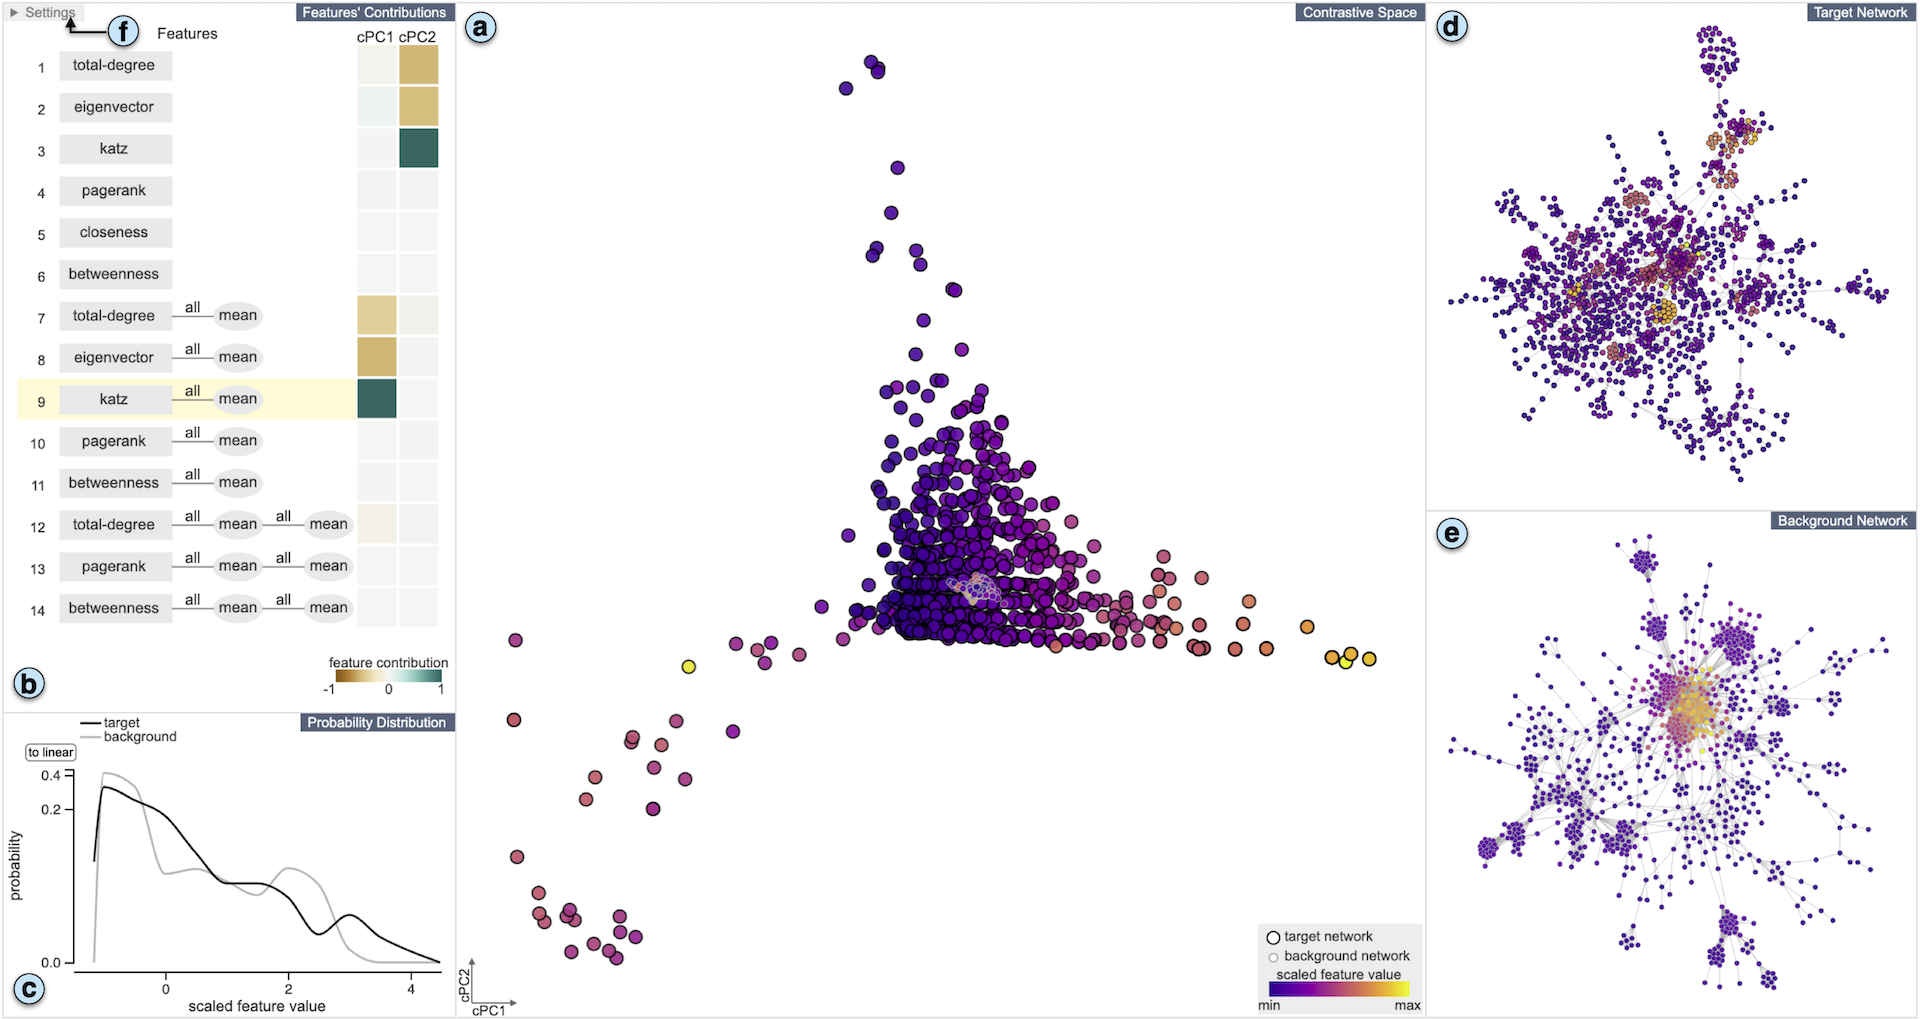
A common network analysis task is comparison of two networks to identify unique characteristics in one network with respect to the other. For example, when comparing protein interaction networks derived from normal and cancer tissues, one essential task is to discover protein-protein interactions unique to cancer tissues. However, this task is challenging when the networks contain complex structural (and semantic) relations. To address this problem, we design ContraNA, a visual analytics framework leveraging both the power of machine learning for uncovering unique characteristics in networks and also the effectiveness of visualization for understanding such uniqueness. The basis of ContraNA is cNRL, which integrates two machine learning schemes, network representation learning (NRL) and contrastive learning (CL), to generate a low-dimensional embedding that reveals the uniqueness of one network when compared to another. ContraNA provides an interactive visualization interface to help analyze the uniqueness by relating embedding results and network structures as well as explaining the learned features by cNRL. We demonstrate the usefulness of ContraNA with two case studies using real-world datasets. We also evaluate through a controlled user study with 12 participants on network comparison tasks. The results show that participants were able to both effectively identify unique characteristics from complex networks and interpret the results obtained from cNRL.