Visual Causality Analysis of Event Sequence Data
Zhuochen Jin, Shunan Guo, Nan Chen, Daniel Weiskopf, David Gotz, Nan Cao
External link (DOI)
View presentation:2020-10-29T15:00:00ZGMT-0600Change your timezone on the schedule page
2020-10-29T15:00:00Z
Fast forward
Direct link to video on YouTube: https://youtu.be/JWhyQxA7SEg
Keywords
event sequence data, causality analysis, visual analytics
Abstract
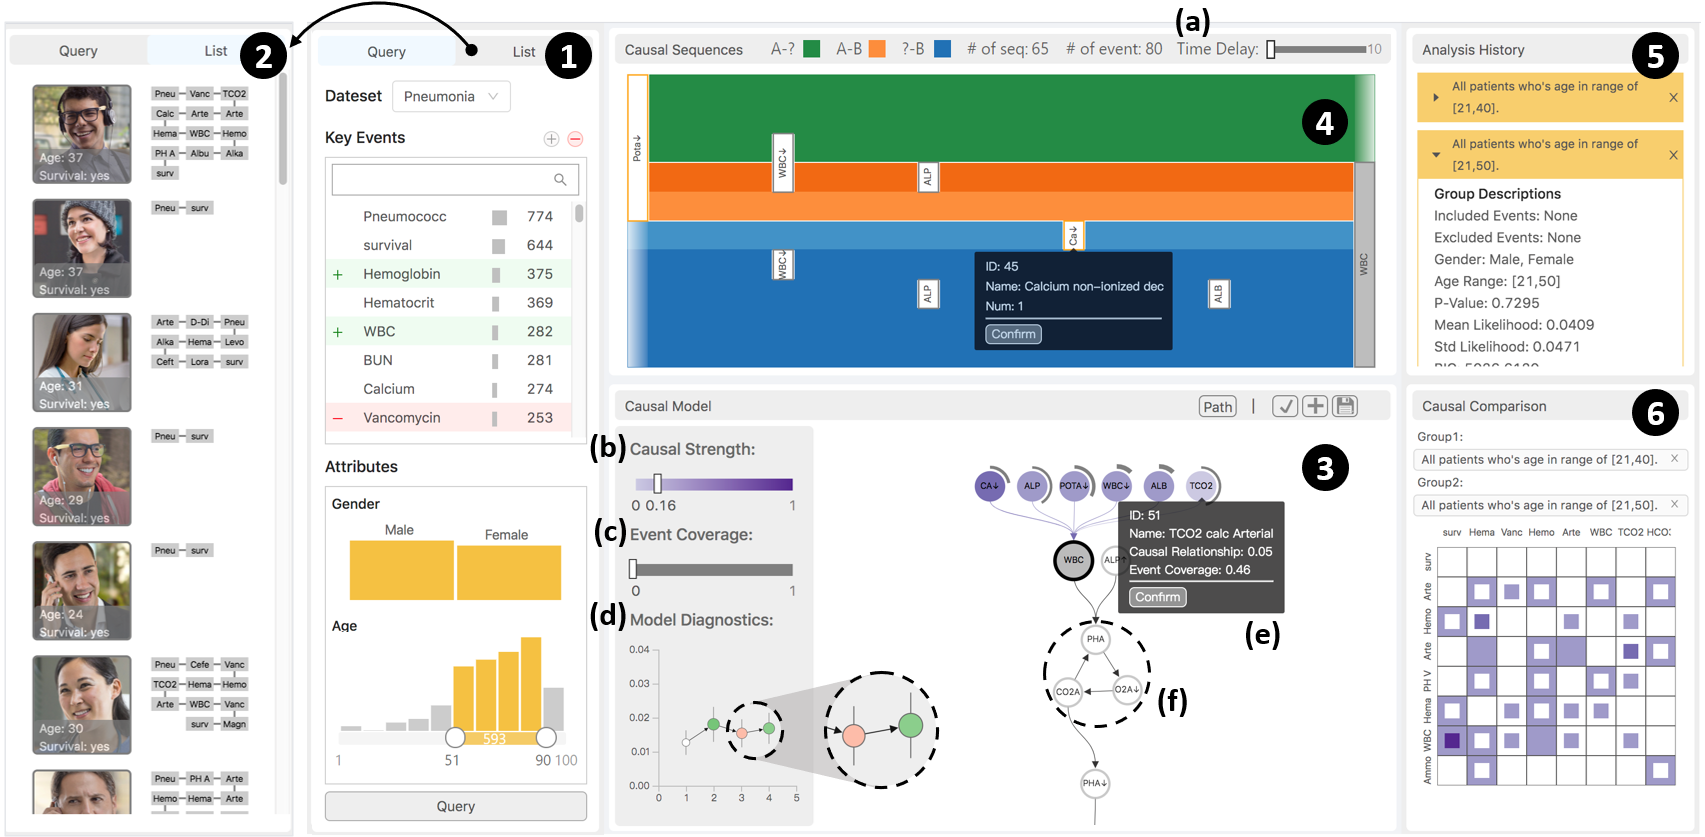
Causality is crucial to understanding the mechanisms behind complex systems and making decisions that lead to intended outcomes. Event sequence data is widely collected from many real-world processes, such as electronic health records, web clickstreams, and financial transactions, which transmit a great deal of information reflecting the causal relations among event types. Unfortunately, recovering causalities from observational event sequences is challenging, as the heterogeneous and high-dimensional event variables are often connected to rather complex underlying event excitation mechanisms that are hard to infer from limited observations. Many existing automated causal analysis techniques suffer from poor explainability and fail to include an adequate amount of human knowledge. In this paper, we introduce a visual analytics method for recovering causalities in event sequence data. We extend the Granger causality analysis algorithm on Hawkes processes to incorporate user feedback into causal model refinement. The visualization system includes an interactive causal analysis framework that supports bottom-up causal exploration, iterative causal verification and refinement, and causal comparison through a set of novel visualizations and interactions. We report two forms of evaluation: a quantitative evaluation of the model improvements resulting from the user-feedback mechanism, and a qualitative evaluation through case studies in different application domains to demonstrate the usefulness of the system.