QLens: Visual Analytics of Multi-step Problem-solving Behaviors for Improving Question Design
Meng Xia, Reshika Palaniyappan Velumani, Yong Wang, Huamin Qu, Xiaojuan Ma
External link (DOI)
View presentation:2020-10-28T16:15:00ZGMT-0600Change your timezone on the schedule page
2020-10-28T16:15:00Z
Keywords
Learning Behavior Analysis, Visual Analytics, Time Series Data
Abstract
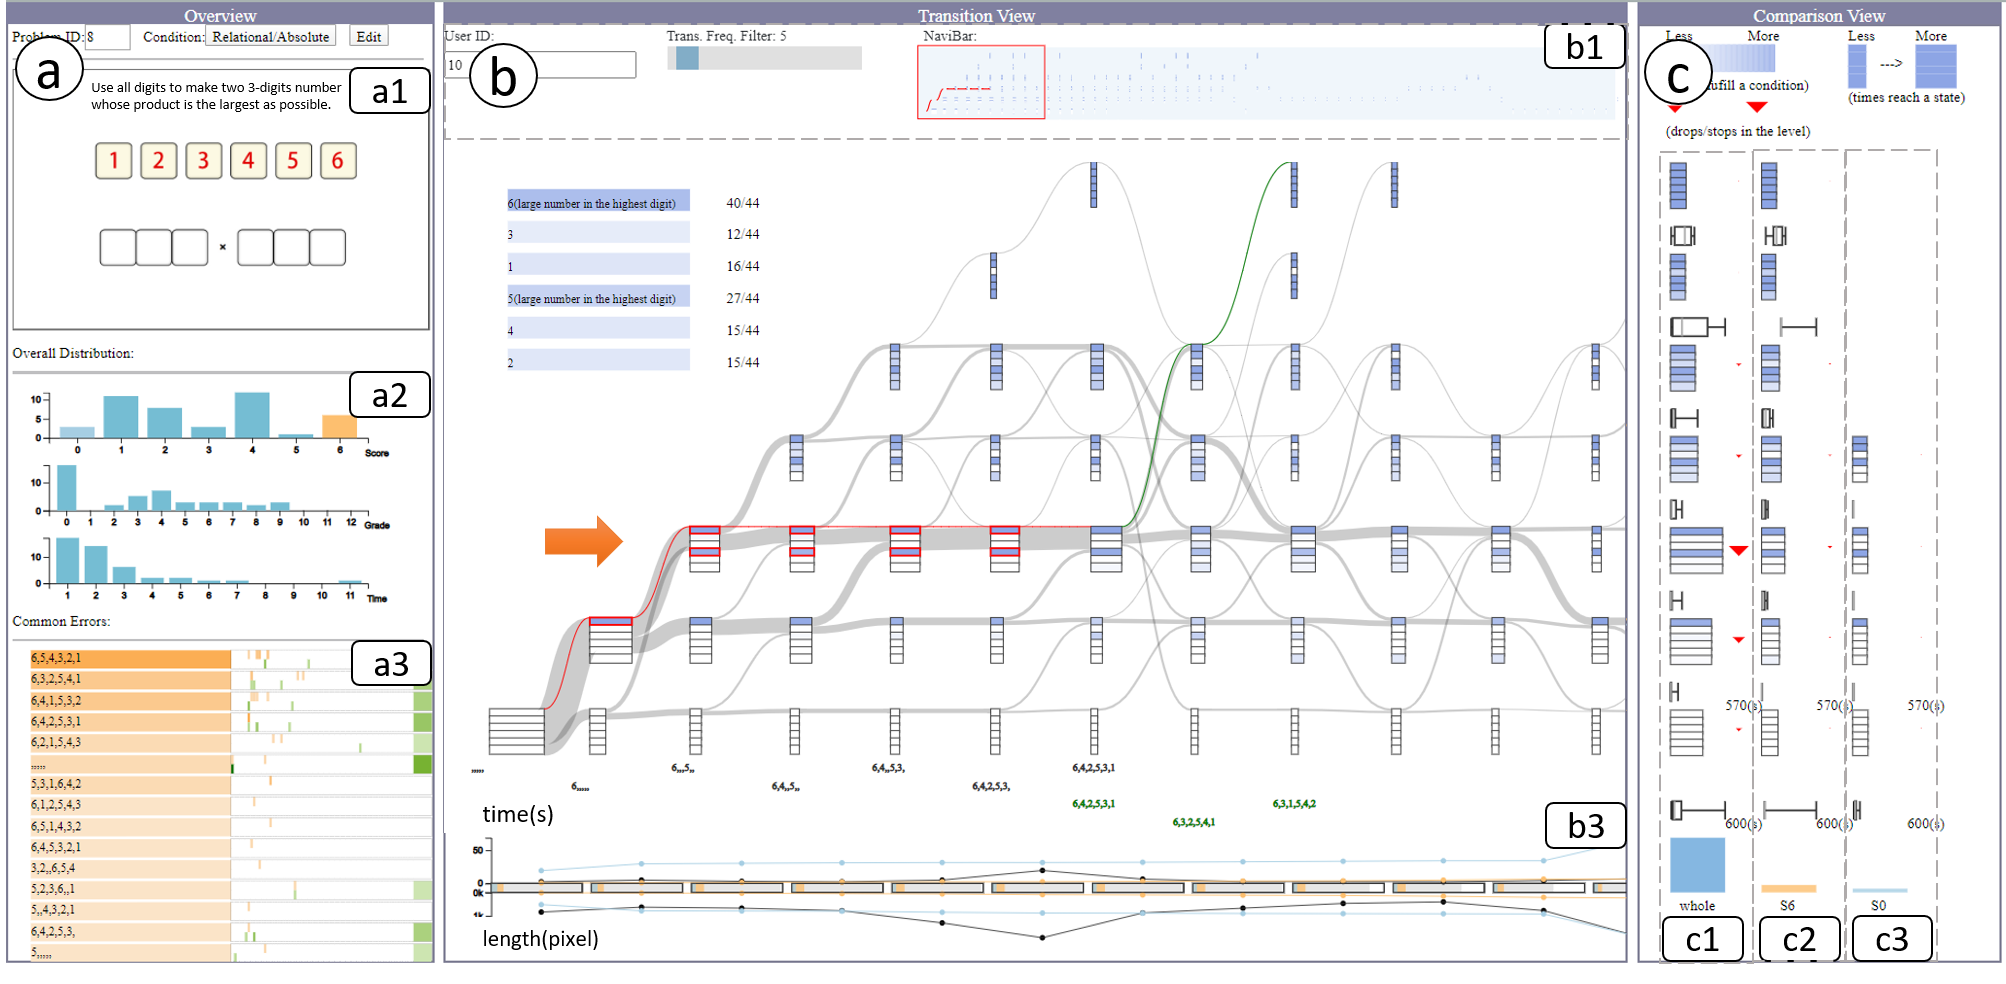
With the rapid development of online education in recent years, there has been an increasing number of learning platforms that provide students with multi-step questions to cultivate their problem-solving skills. To guarantee the high quality of such learning materials, question designers need to inspect how students' problem-solving processes unfold step by step to infer whether students' problem-solving logic matches their design intent. They also need to compare the behaviors of different groups (e.g., students from different grades) to distribute questions to students with the right level of knowledge. The availability of fine-grained interaction data, such as mouse movement trajectories from the online platforms, provides the opportunity to analyze problem-solving behaviors. However, it is still challenging to interpret, summarize, and compare the high dimensional problem-solving sequence data. In this paper, we present a visual analytics system, QLens, to help question designers inspect detailed problem-solving trajectories, compare different student groups, distill insights for design improvements. In particular, QLens models problem-solving behavior as a hybrid state transition graph and visualizes it through a novel glyph-embedded Sankey diagram, which reflects students' problem-solving logic, engagement, and encountered difficulties. We conduct three case studies and three expert interviews to demonstrate the usefulness of QLens on real-world datasets that consist of thousands of problem-solving traces.